10584304
Beschreibung

Mindmap von Payton Kopp, aktualisiert more than 1 year ago
|
|
Erstellt von Payton Kopp
vor mehr als 6 Jahre
|
|
Fundamentals of College Algebra
- Section 1
- 1.2 Visualizing Relationships in Data
- Independent Variable: x- Axis, Input, Domain
- Dependent: y-Axis, Output, Range
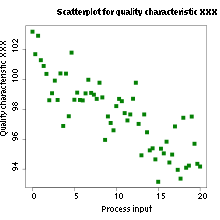
- Scatter plot
- Example
- Independent Variable: x- Axis, Input, Domain
- 1.4 Definition of Function
- A Function is a relation in which each input gives exactly one output
- Example
- Example
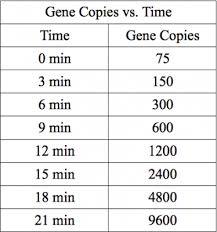
- Uses data tables
- A Function is a relation in which each input gives exactly one output
- 1.5 Function Notation
- y=f(x)
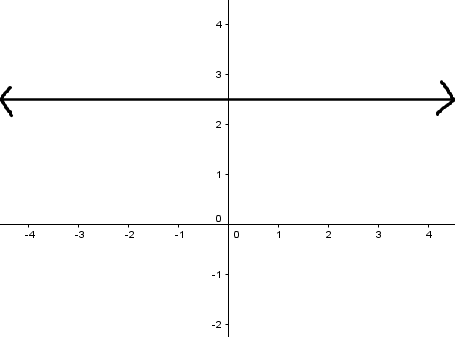
- Constant Graph
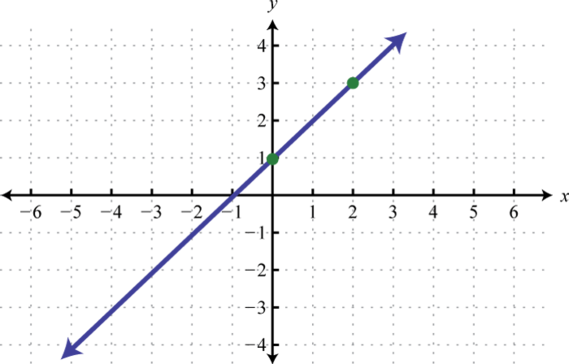
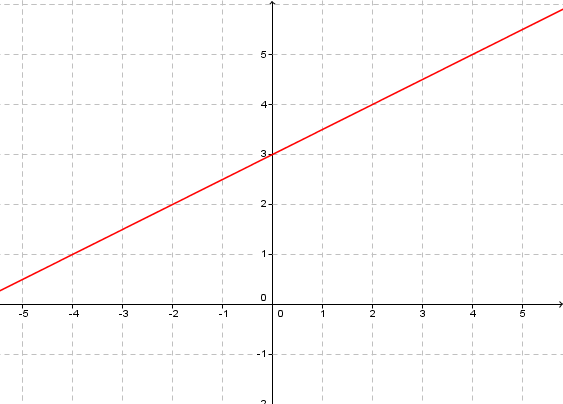
- Linear Graph
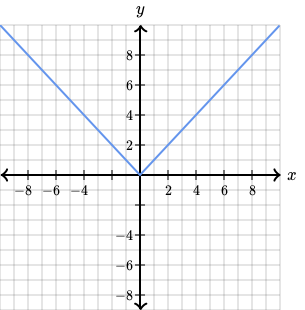
- Absolute Value
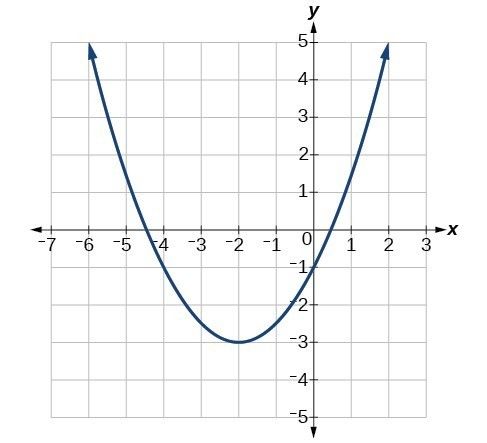
- Quadratic
- y=f(x)
- 1.6 Working with Functions: Graphs
- These are the graphs you get for different
- 1.5 and 1.6 are very similar
- These are the graphs you get for different
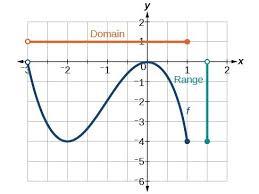
- 1.7 Functions: Getting Information from the Graph
- Domain and Range from a Graph
- Domain and Range from a Graph
- 1.9 Making and Using Formulas
- PV=nRT Solve for T.
- PV=nRT Solve for T.
- 1.2 Visualizing Relationships in Data
- Section 2
- 2.2 Linear Functions: Constant Rate of Changed
- Slope, Rise over Run
- Slope Form: Y= mx + b
- Slope, Rise over Run
- 2.3 Equations of lines: Making Linear Models
- Point Slope Form: (y - y1)= m(x - x1)
- General Form: 0=Ax + By + C
- Horizontal- Intercept Set y=0, plug it in, and solve for x
- Vertical- Intercept Set x=0, plug it in, and solve for x.
- Point Slope Form: (y - y1)= m(x - x1)
- 2.4 Varying the Coefficients: Direct proportionality Parallel & Perpendicular Lines
- A line has a n equation g(t) = 2/3t - 4
- What is the slope? 2/3
- What is the slope a parallel line? 2/3
- What is the slope of a perpendicular line? -3/2
- What is the slope of a perpendicular line? -3/2
- What is the slope a parallel line? 2/3
- What is the slope? 2/3
- y=kx+0
- A Horizontal line has a slope of 0
- A Vertical Line does not have a slope.
- A Vertical Line does not have a slope.
- A line has a n equation g(t) = 2/3t - 4
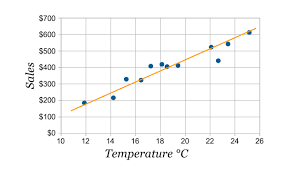
- 2.5 Selecting & Writing Line of Best Fit
- Example
- You pick two points to use to to find the equation of the line of best fit.
- Example
- 2.7 Linear Equations: Points of Intersection
- 2.6 Linear Equations: Getting Information from a Model
- R = 500 - 0.25Q; 100
- Find Q in the equation above using the given R value.
- Find Q in the equation above using the given R value.
- Using model's like this one
- R = 500 - 0.25Q; 100
- 2.2 Linear Functions: Constant Rate of Changed
- Tool Kit
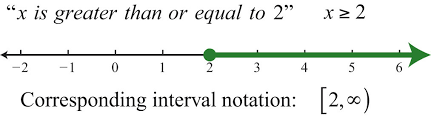
- Linear Inequalities & Interval Notation
- {-1 <x<2}
- Example
- {-1 <x<2}
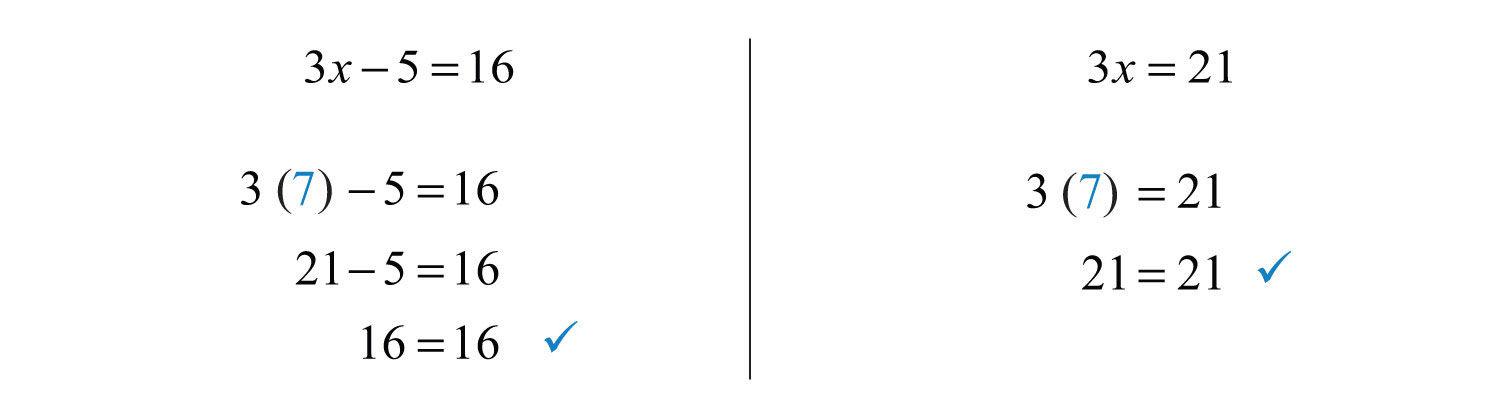
- Solving Basic Equations
- 2(3+x)=2(4x-1)-10
- Example
- 2(3+x)=2(4x-1)-10
- Linear Inequalities & Interval Notation
- 7.1 Solving Systems of Linear Equations in two Variables
- x = 1/2y + 3 8x +3y =-11. substitute x into the other equation. 8(1/2y + 3) +3y = -11. Then solve for y
- x = 1/2y + 3 8x +3y =-11. substitute x into the other equation. 8(1/2y + 3) +3y = -11. Then solve for y
Medienanhänge
Möchten Sie kostenlos Ihre eigenen Mindmaps mit GoConqr erstellen? Mehr erfahren.