1799742
Energy Level Diagrams
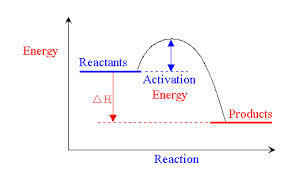
- Exothermic Reactions
- The diagram shows the initial activation energy
(energy needed to break initial bonds) and then
the negative enthalpy change
- The diagram shows the initial activation energy
(energy needed to break initial bonds) and then
the negative enthalpy change
- Endothermic Reactions
- This diagram shows the positive enthalpy
change of an endothermic reaction. The energy
released from forming new bonds is subtracted
from the activation energy to give the final
amount.
- This diagram shows the positive enthalpy
change of an endothermic reaction. The energy
released from forming new bonds is subtracted
from the activation energy to give the final
amount.
- Activation Energy can be lowered with catalysts
- They provide a lower energy pathway to breaking initial bonds
- This is represented by the lower red curve on
the diagram
- This is represented by the lower red curve on
the diagram
- They provide a lower energy pathway to breaking initial bonds
Medienanhänge
Möchten Sie kostenlos Ihre eigenen Mindmaps mit GoConqr erstellen? Mehr erfahren.