2582792
Beschreibung
Mindmap von olga lidia nuñez castillo, aktualisiert more than 1 year ago
|
|
Erstellt von olga lidia nuñez castillo
vor mehr als 10 Jahre
|
|
SAB5#81
7_TOOLS_BASIC-QUALITY
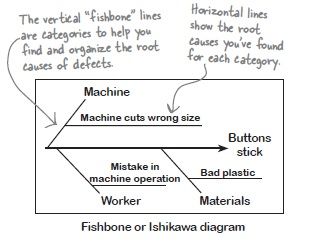
- Caused and effect diagram
Anmerkungen:
- Caan also be used to plan how the work of quality should be performed to produce deliverables thah meet requirements.
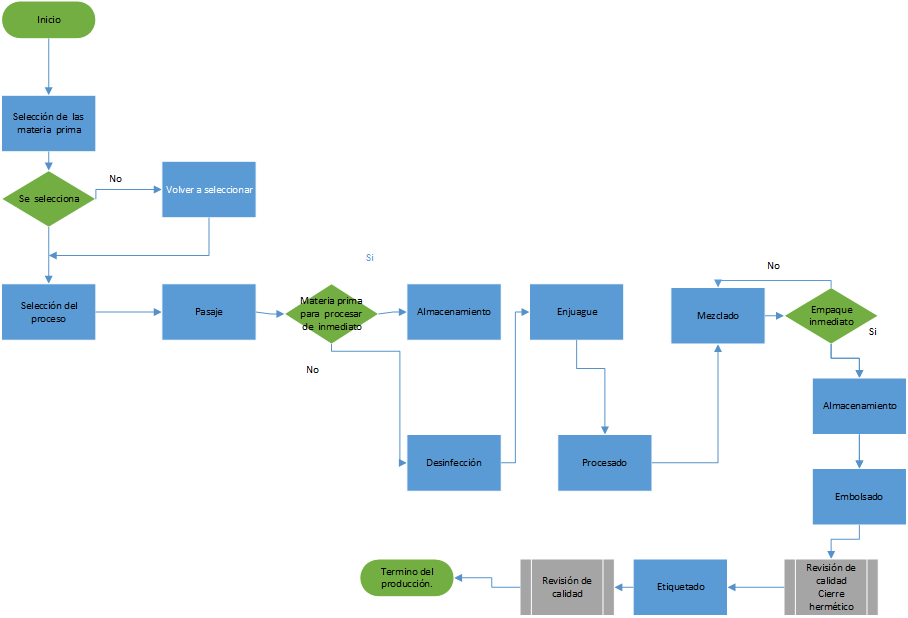
- Flowchart
Anmerkungen:
- You can use a flowchar to show how the tasks in your project interrelate and what they depend on. They are also good for showing decision - making process
- Cheksheet ( Tally Sheet)
Anmerkungen:
- You can use them organiza the test activities you¨ll be perfoming and track whether the product passes or fails test.
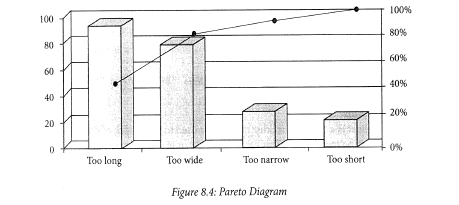
- Pareto Diagram (Pareto Chart)
Anmerkungen:
- In fact, that´s called the 80/20 rule --- 80 % oh the defects are usually caused by 20 % of the causes.
- Histogram
Anmerkungen:
- Histograma son grandes for helping you to compare characterist
- Control Chart
- Upeer and lower control limits
- Mean ( Average)
- Specification Limits
- Upeer and lower control limits
- Scatter diagram
Medienanhänge
Möchten Sie kostenlos Ihre eigenen Mindmaps mit GoConqr erstellen? Mehr erfahren.