4059827
Beschreibung
Mindmap von Benjamin Mark Cottam, aktualisiert more than 1 year ago
|
|
Erstellt von Benjamin Mark Cottam
vor etwa 10 Jahre
|
|
Rational Function Graphing
- 1. Domain
- Everything except values that make the
denominator = 0
- Ex. 3x/x+10
- Domain: x=all real
numbers except -10
- Domain: x=all real
numbers except -10
- Everything except values that make the
denominator = 0
- 2. X Intercepts
- Set f(x)=0, solve for x
- Ex. 3x/x+10
- X Intercept=(0,0)
- X Intercept=(0,0)
- Set f(x)=0, solve for x
- 3. Y Intercepts
- Set x=0, then solve
- Ex. 3x/x+10
- Y Intercept=(0,0)
- Y Intercept=(0,0)
- Set x=0, then solve
- 4. Horizontal Asymptotes
- Compare degrees of
numerator and denominator
- If top=bottom: Ratio of
leading exponents
- If bottom>top: y=0
- If top>bottom: No
horizontal asymptotes
- If top=bottom: Ratio of
leading exponents
- Ex. 3x/x+10
- Horizontal Asymptote=(y=3)
- Horizontal Asymptote=(y=3)
- Compare degrees of
numerator and denominator
- 5. Vertical Asymptotes
- Simplify polynomial then find the
zeroes of the denominator
- Ex. 3x/x+10
- Vertical
Asymptotes=(x=-10)
- Vertical
Asymptotes=(x=-10)
- Simplify polynomial then find the
zeroes of the denominator
- 6. Plot Additional Points
- Plug x values into function, plot
the points that come out of it
- Ex.
- f(2)=3x/x+10
- f(-3)=3x/x+10
- f(2)=3x/x+10
- Plug x values into function, plot
the points that come out of it
- Graphed Examples
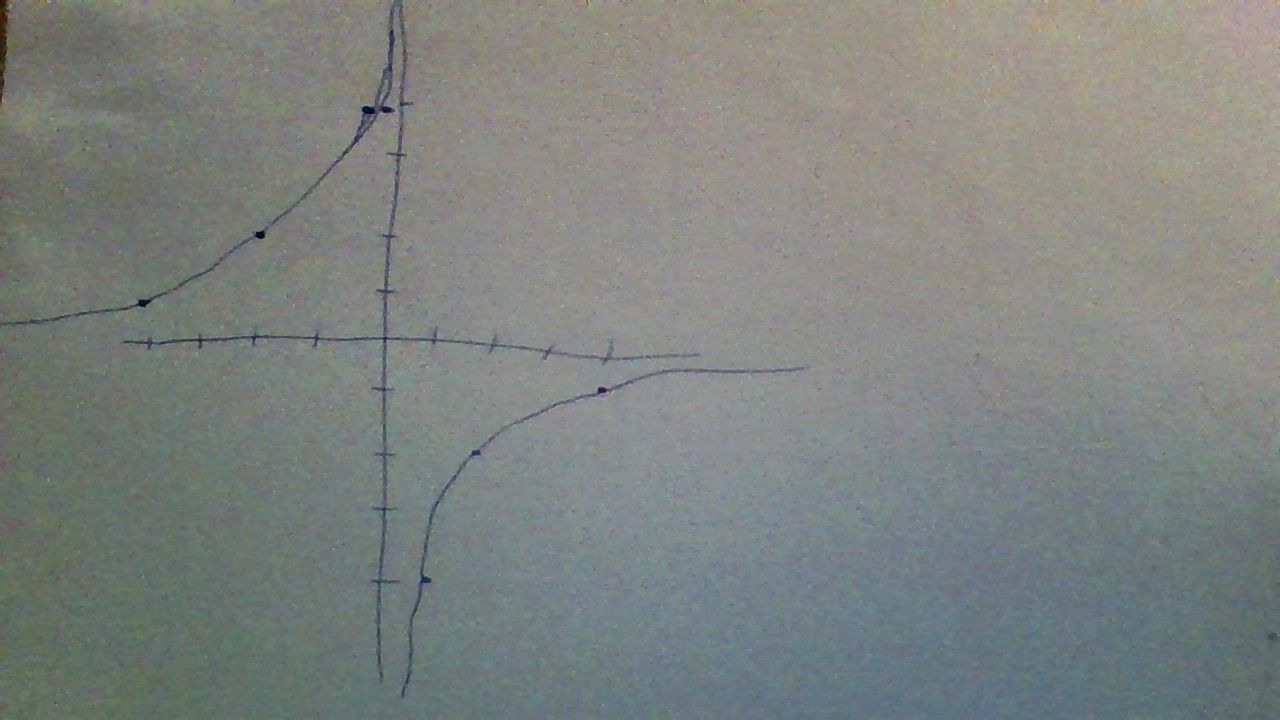
- f(x)=4/x
- Domain: x≠0, No x intercept,
No y intercept, V. Asymptote
x=0, H. Asymptote y=0
- Domain: x≠0, No x intercept,
No y intercept, V. Asymptote
x=0, H. Asymptote y=0
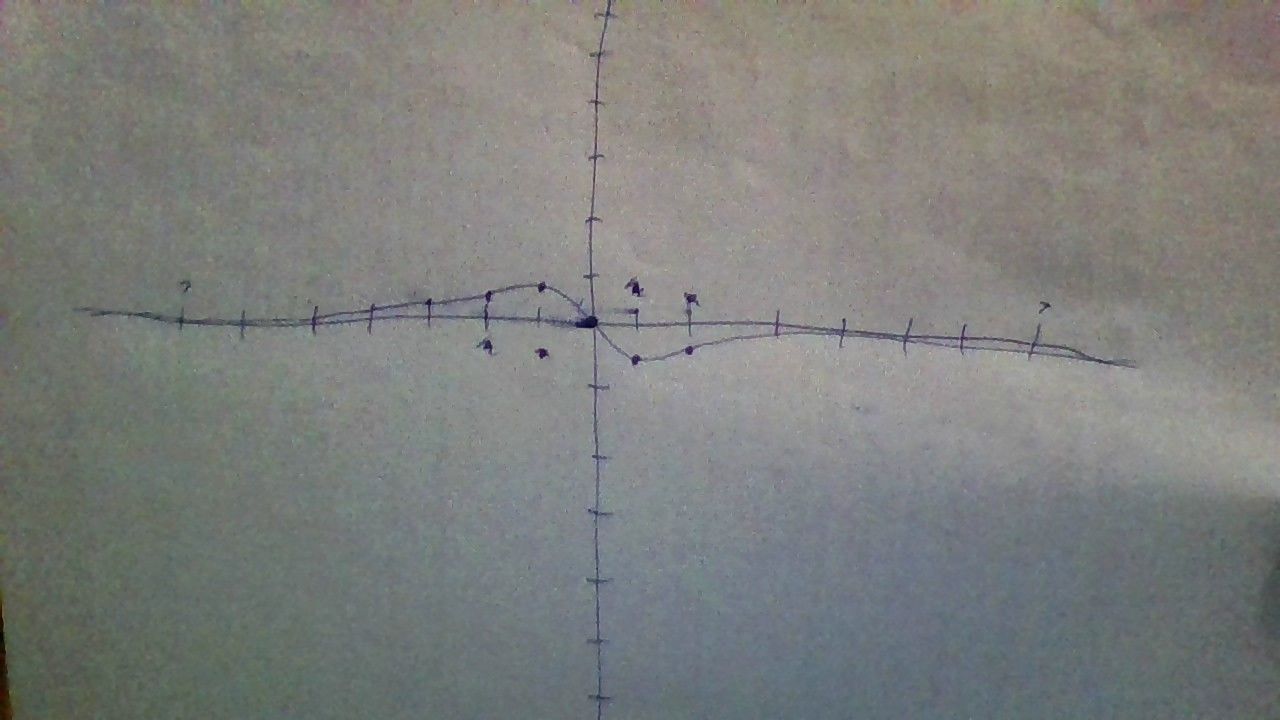
- Domain: All real numbers, x/y
intercept (0,0), H. Asymptote:
y=0, V. Asymptote: None
- f(x)=4/x
Medienanhänge
Möchten Sie kostenlos Ihre eigenen Mindmaps mit GoConqr erstellen? Mehr erfahren.