948565
Energetics + Kinetics
- Thermochemistry: This is the study of heat changes in a chemical reaction
- During a chemical reaction:
- Bonds are broken:
- Endothermic
- Takes energy from the surroundings
- Takes energy from the surroundings
- Endothermic
- Bonds are reformed:
- Exothermic
- Gives energy to the surroundings
- Gives energy to the surroundings
- Exothermic
- Whether an reaction is endo or exo thermic
overall, you need to decide whether more
energy is given out, or more energy is taken in
- If more energy is given out i.e. reactants -
products = -ve, then you have an
exothermic reaction
- If more enrgy is taken in i.e. reactants-products = +ve,
then you have an endothermic reaction
- If more energy is given out i.e. reactants -
products = -ve, then you have an
exothermic reaction
- Bonds are broken:
- During a chemical reaction:
- Enthalpy change is the heat energy change of
a chemical reaction under constant pressure
- An enthalpy diagram looks like so:
- The peak is called the intermediate stage or the transition state
- In an endothermic reaction, the products have more energy than the reactants
- In an exothermic reaction, the products have less energy than the reactants
- In an exothermic reaction, the products have less energy than the reactants
- In an endothermic reaction, the products have more energy than the reactants
- The peak is called the intermediate stage or the transition state
- An enthalpy diagram looks like so:
- Measuring energy change:
- 1. Measuring heat energy change of 2 solutions
- We need to know the difference
between temperature and heat
- Heat: The total kinetic energy of all the
particles in a given substance. It is dependent
on the no. of particles present
- Temperature: This is the AVERAGE kinetic
energy for any particle at any given point. It is not
dependent of the number of particles present
- Heat: The total kinetic energy of all the
particles in a given substance. It is dependent
on the no. of particles present
- What happens is that you have 2 solutions of known conc and known volume
- You bring them both down to room temperature and note it down
- Mix the 2 solutions
- Measure the temperature at the end
- Note the temperature change
- Put it into the formula:
- q = m x c x delta t
- q is the heat energy change
- Measured in J
- To find the heat energy change per
mole you put your values into:
- Delta H = q/n
- Delta H is measure in kJ per mole so you
have to make sure you convert q from J to kJ
by dividing by 1000
- Remember, if the reaction is exothermic, then the energy change will be negative
- Remember, if the reaction is exothermic, then the energy change will be negative
- Delta H is measure in kJ per mole so you
have to make sure you convert q from J to kJ
by dividing by 1000
- Delta H = q/n
- To find the heat energy change per
mole you put your values into:
- Measured in J
- m is the mass of the substance being
heated, in this case it is the solution, so it's
the total volumes added together
- measured in grams where 1cm3 = 1g
- measured in grams where 1cm3 = 1g
- C is the specific heat capacity.
Water has a SHC of 4.18
- measured in J/g-1/k-1
- measured in J/g-1/k-1
- Delta is the temp change
- measured in degrees or kelvin
- measured in degrees or kelvin
- q is the heat energy change
- q = m x c x delta t
- Put it into the formula:
- Note the temperature change
- Measure the temperature at the end
- Mix the 2 solutions
- You bring them both down to room temperature and note it down
- We need to know the difference
between temperature and heat
- 2. Calorimetry
- This is the process used to
describe another way of
measuring heat energy change
- This is usually used when you've got a
substance that you dont want to waste
- e.g. some new type of fuel
- You put it in a spirit burner
- Light it up and heat a known volume of water
- Record initial temp
- Light for however long you want. When you've
finished, weigh the final mass of spirit burner
- Record final temp of water
- Put it in the formula: q= m x c x deltaT
- m will be the mass of the
water that has been heated
- then use the formula delta H = q/n
- use n=m/mr to find n
- use n=m/mr to find n
- then use the formula delta H = q/n
- m will be the mass of the
water that has been heated
- Put it in the formula: q= m x c x deltaT
- Record final temp of water
- Record initial temp
- Record initial mass
- Light it up and heat a known volume of water
- You put it in a spirit burner
- e.g. some new type of fuel
- Assumptions:
- We assume that all the heat is transferred to the
water, but that's not true, some of it could be
transferred to the beaker or the air
- This could be fixed using a polystyrene cup
- putting a lid on it
- A draught screen to stop flame from flickering
- A draught screen to stop flame from flickering
- putting a lid on it
- This could be fixed using a polystyrene cup
- We assume that all the heat is transferred to the
water, but that's not true, some of it could be
transferred to the beaker or the air
- This is usually used when you've got a
substance that you dont want to waste
- This is the process used to
describe another way of
measuring heat energy change
- 3. Mean bond enthalpies
- This is defined as the amount of energy
required to break one mole of a particular
covalent bond averaged over several compund
where the bond exists in a gaseuous state.
- It is averaged over several compounds
because the particular bond might be easier
to break when in one compound but difficult to
break when in another compound
- The fact that an average is used means that the
enthalpy change might not be as accurate
- You get given a table of values
- You add up the total number of bond and
multiply it by its M.B.E
- Then you do reactants - products
- Then you do reactants - products
- You add up the total number of bond and
multiply it by its M.B.E
- You get given a table of values
- The fact that an average is used means that the
enthalpy change might not be as accurate
- It is averaged over several compounds
because the particular bond might be easier
to break when in one compound but difficult to
break when in another compound
- This is defined as the amount of energy
required to break one mole of a particular
covalent bond averaged over several compund
where the bond exists in a gaseuous state.
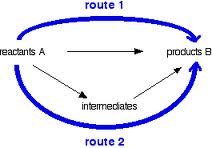
- 4. The use of Hess's Law
- This law states that the enthalpy change of a
reaction is independent of the route taken
- In other words, the energy it takes to go from A to B is
the same as the energy it takes to go from A to C + the
energy is takes to go from C to B because you start at
the same place and you finish at the same place
- In other words, the energy it takes to go from A to B is
the same as the energy it takes to go from A to C + the
energy is takes to go from C to B because you start at
the same place and you finish at the same place
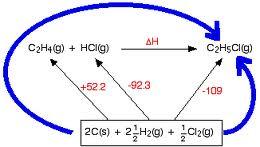
- a) The standard enthalpy of formation
- This is defined as the enthalpy change when one mole of a
compound is formed from its constituent element under standard
condition where the reactant and products are in their standard states
- Standard Conditions: 25 degrees, 1 atm
- This just means, how much energy do you
need to form 1 mole of a compound from its
elements?
- We can use thermodynamic cycles to help us
- With formation, the arround is
always going from the elements, to
the reaction e.g.:
- You the add the energies
- You the add the energies
- With formation, the arround is
always going from the elements, to
the reaction e.g.:
- We can use thermodynamic cycles to help us
- Standard Conditions: 25 degrees, 1 atm
- This is defined as the enthalpy change when one mole of a
compound is formed from its constituent element under standard
condition where the reactant and products are in their standard states
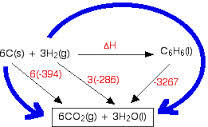
- b) The standard enthalpy of combustion
- This is defined as the enthalpy change when one mole of a compund
is completely burned in excess oxygen under standard conditions
where the reactants and products are in their standard states
- Here we look at the enthalpy values when we
combust the products and reactants
- We can also use the thermodynamic cycle here
- Here, the arrows go from the products and
reactants, down to the oxides that they combust to
- If anything is going in the opposite direction than what
we want, then we just reverse the sign on the value
- If anything is going in the opposite direction than what
we want, then we just reverse the sign on the value
- Here, the arrows go from the products and
reactants, down to the oxides that they combust to
- We can also use the thermodynamic cycle here
- Here we look at the enthalpy values when we
combust the products and reactants
- This is defined as the enthalpy change when one mole of a compund
is completely burned in excess oxygen under standard conditions
where the reactants and products are in their standard states
- This law states that the enthalpy change of a
reaction is independent of the route taken
- 1. Measuring heat energy change of 2 solutions
- Kinetics is the study of the rate at which chemical reactions proceed
- It is also the study of factors that speed up the rate of reactions
- Rate of reaction: This is the change in the
concentration of reactants/products per unit time
- It is also the study of factors that speed up the rate of reactions
- Collision theory
- This the idea that in order for a reaction to take place, a collision is required
- Reactants need to collide with a big enough force so that bonds are broken.
- This is done by achieving the activation energy
- This is the minimum amount of energy required to start off a reaction/have a succesful collision
- The reactants also need to be in the correct orientation, meaning the
molecules that play an active part need to be facing the same way
- The reactants also need to be in the correct orientation, meaning the
molecules that play an active part need to be facing the same way
- This is the minimum amount of energy required to start off a reaction/have a succesful collision
- This is done by achieving the activation energy
- Reactants need to collide with a big enough force so that bonds are broken.
- This the idea that in order for a reaction to take place, a collision is required
- Factors that affect the rate of a reaction
- Surface Area
- Temperature
- Conc/Pressure
- Catalyst
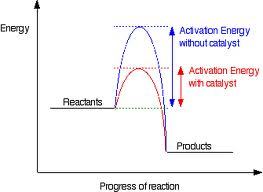
- A catalyst is a substance that speeds
up a reaction whilst remaining
chemically unchanged
- It works by providing an alternative
route with a lower activation energy
- The enthalpy diagram looks like this:
- The enthalpy diagram looks like this:
- There are 2 types of catalysis
- Heterogenous
- This is where the catalyst and the reactants are in different phases
- There is a distinct boundary between them
- There is a distinct boundary between them
- Examples:
- Catalytic Converters in cars
- Catalyst Used: Platinum, Iridium, Rhodium
- Reactants: NOx's, CO, C, unburned hydrocarbons
- Products: N2, CO2, H2O
- Use: Removing harmful gases and pollutants
- Poison: Lead
- Poison: Lead
- Catalyst Used: Platinum, Iridium, Rhodium
- Catalytic cracking
- Catalyst: Zeolite (Aluminium Silicate) (s)
- Reactants: Long chain Alkanes (l)
- Products: Cycloalkanes, branched alkanes
- Use: More useful fractions
- Use: More useful fractions
- Products: Cycloalkanes, branched alkanes
- Reactants: Long chain Alkanes (l)
- Catalyst: Zeolite (Aluminium Silicate) (s)
- The Haber Process
- Catalyst: Iron (Fe) (s)
- Reactants: N2, H2 (g)
- Products: NH3
- Uses: Fertiliser, Drugs, Dyes
- Uses: Fertiliser, Drugs, Dyes
- Products: NH3
- Reactants: N2, H2 (g)
- Catalyst: Iron (Fe) (s)
- Hydration of Ethene
- Catalyst: H3PO4 on an inert silica support
- Reactancts: C2H4, H2O
- Products: C2H5OH
- Uses: chemical feedstock, solvents, detergents, fuel
- Uses: chemical feedstock, solvents, detergents, fuel
- Products: C2H5OH
- Reactancts: C2H4, H2O
- Catalyst: H3PO4 on an inert silica support
- Catalytic Converters in cars
- This is where the catalyst and the reactants are in different phases
- Homogenous
- This is where the catalyst and the reactants are in the same phase
- Meaning there is no distinct boundary between them
- Meaning there is no distinct boundary between them
- Free Radical Substitution:
- Catalyst: Chlorine free radical
- Reactants: Methane, chlorine
- Products: Chloromethane
- Uses: Refrigerants
- Uses: Refrigerants
- Products: Chloromethane
- Reactants: Methane, chlorine
- Catalyst: Chlorine free radical
- Hydrogenation of alkenes
- Catalyst used: Nickel
- Reactants: C2H4 and H2
- Products: C2H6
- Uses: Making margerine
- Uses: Making margerine
- Products: C2H6
- Reactants: C2H4 and H2
- Catalyst used: Nickel
- This is where the catalyst and the reactants are in the same phase
- Heterogenous
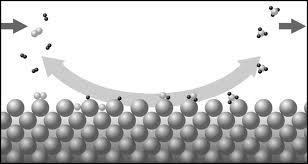
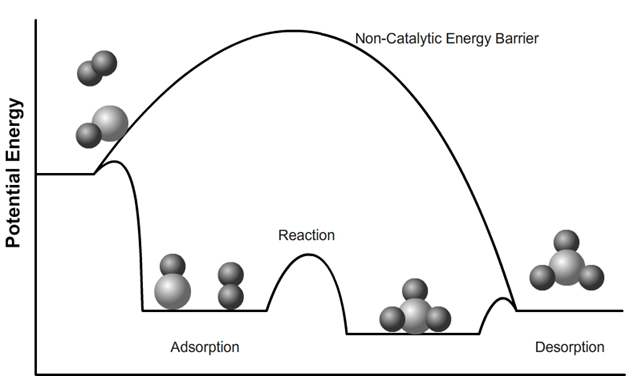
- Catalysis takes place in 3 stages:
- 1. Adsorption
- The formation of weak temporary bonds
of the catalyst and the reactants
- The strength of adsorption needs to be monitered,
we can't have bonds that are too strong
- The strength of adsorption needs to be monitered,
we can't have bonds that are too strong
- The formation of weak temporary bonds
of the catalyst and the reactants
- 2. Reaction takes place
- 3. Desorption: Where the products and
now seperate from the catalyst
- 1. Adsorption
- A catalyst is a substance that speeds
up a reaction whilst remaining
chemically unchanged
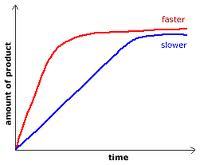
- Increasing any of these will increase the rate of
reaction. This can be shown on a diagram
- A steeper curve shows a greater rate of reaction
- The diagram shows that at the start of a reaction, there's a
faster rate because there are more reactants to have a
succesful collision with because there are more reactants around
- As time goes on, the rate slows down becayse there's not as
many reactants left and the producst get in the way of a
succesful collision
- As time goes on, the rate slows down becayse there's not as
many reactants left and the producst get in the way of a
succesful collision
- A steeper curve shows a greater rate of reaction
- Surface Area
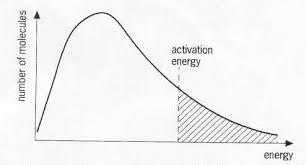
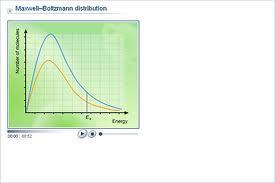
- Maxwell Boltzman Distrbution Diagram
- This is a diagram that shows the
distribution of energy or spread of
energy amongst particles in a sample
- The peak of the graph shows the most probable energy
- The average energy will always be to the right of the curve
- The area under the curve represents the total number of particles
- The curve never meets the axis because you can never
predict the maximum amount of energy that a particle will have
- If you lower the temp, you get a sharper peak near the
lower end: More particles have a lower energy
- If you increase the temp you get a broader peak because the
energy is spread over a range of higher energies
- More particles have an energy that is greater
than or equal to the activation energy
- This is why there is a higher rate of reaction
- This is why there is a higher rate of reaction
- The area under the curve will remain the same
- Both conc and pressure will have the same
affect on the graph
- An increase will shift the graph up
- A decrease will shift the graph down
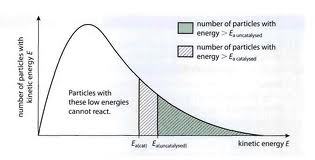
- The use of a catalyst will shift the Ea
- There will be more particles with an energy that is
greater than or equal to the activation energy
- There will be more particles with an energy that is
greater than or equal to the activation energy
- The use of a catalyst will shift the Ea
- A decrease will shift the graph down
- There will be more or less particles with an energy
that is greater than or equal to the activation energy
- An increase will shift the graph up
- Both conc and pressure will have the same
affect on the graph
- More particles have an energy that is greater
than or equal to the activation energy
- Fewer particles have an energy that is greater
than or equal to the activation energy
- This is why there is a lower rate of reaction
- This is why there is a lower rate of reaction
- If you increase the temp you get a broader peak because the
energy is spread over a range of higher energies
- If you lower the temp, you get a sharper peak near the
lower end: More particles have a lower energy
- The curve never meets the axis because you can never
predict the maximum amount of energy that a particle will have
- The area under the curve represents the total number of particles
- The average energy will always be to the right of the curve
- The peak of the graph shows the most probable energy
- This is a diagram that shows the
distribution of energy or spread of
energy amongst particles in a sample
Medienanhänge
Möchten Sie kostenlos Ihre eigenen Mindmaps mit GoConqr erstellen? Mehr erfahren.