Beschreibung
|
|
Erstellt von Ellen Billingham
vor fast 11 Jahre
|
|
Seite 1
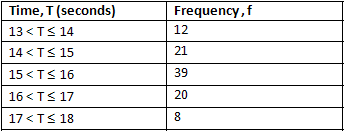
Here is an example of a grouped frequency table:
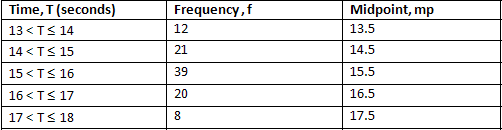
You want to estimate the mean of this data.In order to do this, you need to have a value that you can use to find the mean. The most accurate way of doing this, as you don't have the specific values, is to use the number halfway between the numbers it could be. This is called the midpoint and you should end up with something like this:
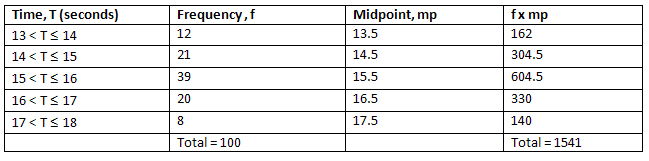
Now that you have some values for the grouped data, you can make an estimate for the mean. Multiply the frequency and the midpoint together, and then add up the answers. This will give you the total, which you will need to divide by the total frequency in order to get the mean.
This is what your table should now look like. All you need to do now is do 1541 divided by 100 to find the mean.The answer is 15.41. This is your estimate for the mean of this grouped frequency table.
New Page
Möchten Sie kostenlos Ihre eigenen Notizen mit GoConqr erstellen? Mehr erfahren.