19272432
Frage 1
Frage
To find the [blank_start]median[blank_end] you must order the data first.
Antworten
-
median
-
mean
-
mode
Frage 2
Frage
To make a box and whisker graph, which value do you NOT need?
Antworten
-
median
-
lower quartile (Q1)
-
upper quartile (Q3)
-
range
-
minimum
-
maximum
Frage 3
Frage
The range is the highest value [blank_start]minus[blank_end] the lowest value
Antworten
-
minus
-
plus
-
multiplied by
Frage 4
Antworten
- True
- False
Frage 5
Frage
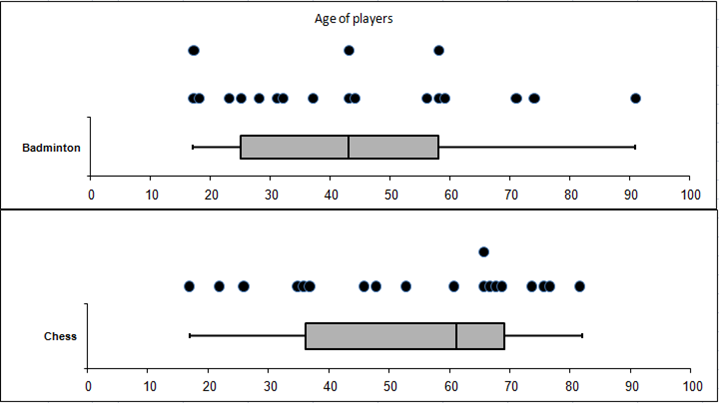
The whiskers at each end of the box are the highest and lowest 10% of data
Image:
Image (binary/octet-stream)
Antworten
- True
- False
Frage 6
Frage
The length of the box is the IQR (inter quartile range). How do you calculate the IQR?
Image:
Image (binary/octet-stream)
Antworten
-
Pick a number between 1 and 10
-
Add all the numbers and divide by how many there are
-
Subtract Q1 from Q3
-
Subtract the minimum from the maximum value.
Frage 7
Frage
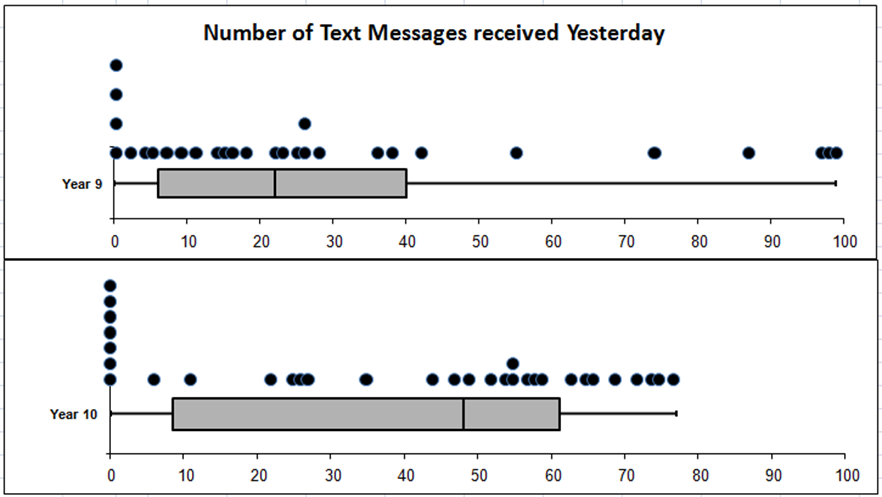
The IQR of the Year 9s is [blank_start]smaller[blank_end] than the IQR of the Year 10s.
Image:
Image (binary/octet-stream)
Antworten
-
smaller
-
bigger
-
equal to
Frage 8
Antworten
-
7
-
0
-
4
Frage 9
Antworten
-
skewed
-
uneven
-
symmetrical
Frage 10
Frage
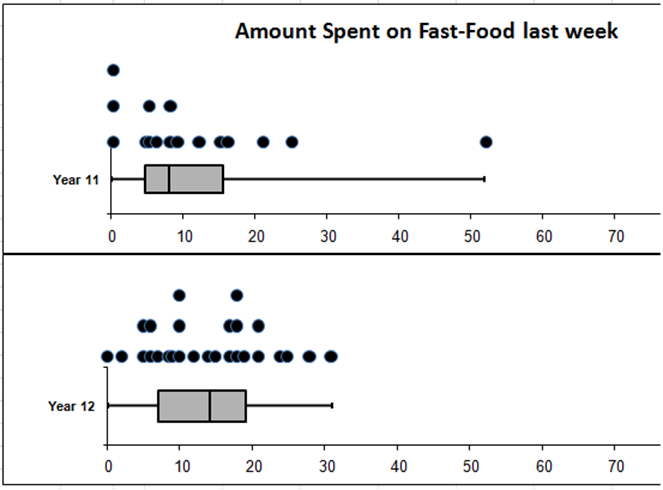
The IQR for the Year 11s is similar to the IQR of year 12s. True or false?
Image:
Image (binary/octet-stream)
Antworten
- True
- False
Möchten Sie mit GoConqr kostenlos Ihre eigenen Quiz erstellen? eigenen Mehr erfahren.