18594561
| Frage | Antworten |
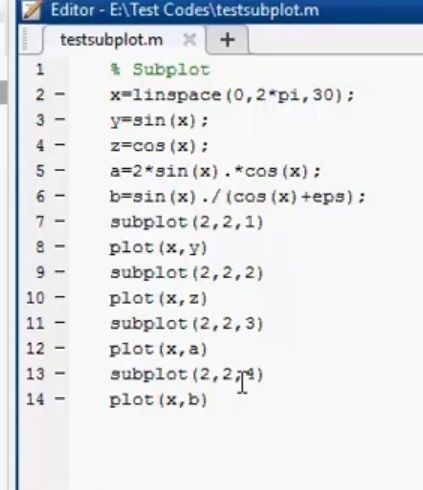
| How do you layout MATLAB to create four subplots in one figure window | |
| What function controls the font size and line width of certain aspects of graphs | set(gca?,.....) |
| Save the graph in tif format with a resolution of 300 ppi | print('name','-dtiff,-r300) |
| Assign the variable A the data in the data file 'data1.txt' | A=dlmread('data1.txt') |
| Save a matrix in ASCII format as txt file | dlmwrite('data.txt',x,',') |
| Procedure for plotting differential of data |
Möchten Sie mit GoConqr kostenlos Ihre eigenen Karteikarten erstellen? Mehr erfahren.