8329247
Description
Quiz by Michaela Juric-Donlan, updated more than 1 year ago
|
|
Created by Michaela Juric-Donlan
over 8 years ago
|
|
Question 1
Question
Which of the following shifts the supply curve for oranges?
Answer
-
An increase in income for all orange consumers if oranges are a normal good.
-
Disastrous weather that destroys about half of this year's orange crop.
-
An increase in the number of orange consumers.
-
A newly discovered increase in the nutritional value of oranges.
-
An increase in the price of bananas, a substitute in consumption for oranges.
Question 2
Question
Which of the following increases the demand for a good or service?
Answer
-
A rise in the price of the good or service.
-
A fall in the price of the good or service.
-
A rise in the price of a substitute good or service.
-
A rise in the price of a complement.
-
A smaller number of consumers wanting to buy the good or service.
Question 3
Question
There are five hundred buyers in the market for cheese. If we know each individual's demand curves, to find the market demand we must
Answer
-
give up because there is no way to find the market demand.
-
average the price each buyer is willing to pay for each given quantity.
-
add the quantities that each buyer will purchase at every price.
-
multiply the price times quantity for each buyer and then add the resulting products together.
-
add the prices that each buyer will pay at every quantity.
Question 4
Question
Consumers eat salsa with corn chips. The price of salsa rises. How does the increase in the price of salsa affect the demand for corn chips?
Answer
-
It decreases the demand for corn chips.
-
It will decrease the demand for corn chips only if corn chips are a normal good.
-
It has no effect on the demand for corn chips.
-
It increases the demand for corn chips.
-
It could increase, decrease or have no effect on the demand for corn chips, but more information is needed to determine the impact.
Question 5
Question
Two brands of water, Natural Water and Mountain Water, are close substitutes. If the price of Mountain Water decreases, the fall in price
Answer
-
increases the demand for Mountain Water.
-
shifts the demand curve for Natural Water leftward.
-
increases the price of Natural Water.
-
shifts the demand curve for Natural Water rightward.
-
More information is needed to determine if the demand curve for Natural Water shifts rightward or leftward.
Question 6
Question
In the figure above, a price of $15 per dozen roses results in
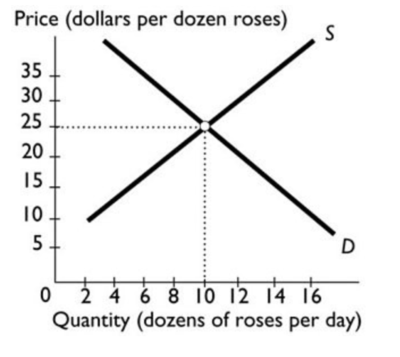
Answer
-
a surplus.
-
equilibrium.
-
downward pressure on the price of roses.
-
a shortage.
-
an eventual leftward shift of the demand curve and/or rightward shift of the supply curve.
Question 7
Question
Using the data in the table above, at the price of $80 a phone,
Answer
-
a surplus of 25,000 cellular phones occurs.
-
a shortage of 25,000 cellular phones occurs.
-
the market is in equilibrium.
-
a shortage of 55,000 cellular phones occurs.
-
a surplus of 80,000 cellular phones occurs.
Question 8
Question
Using the data in the table above, the equilibrium quantity and equilibrium price for a cellular phone is
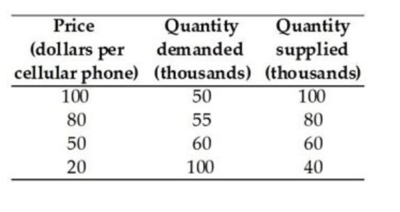
Answer
-
40,000 and $20
-
50,000 and $100
-
60,000 and $50
-
100,000 and $20
-
80,000 and $80
Question 9
Question
Pizza is a normal good. Which figure above shows the effect of a decrease in consumers' incomes?
Answer
-
Figure C
-
Figure D
-
Figure B
-
Figure A
Question 10
Question
Which figure above shows the effect of a decrease in the number of pizza sellers?
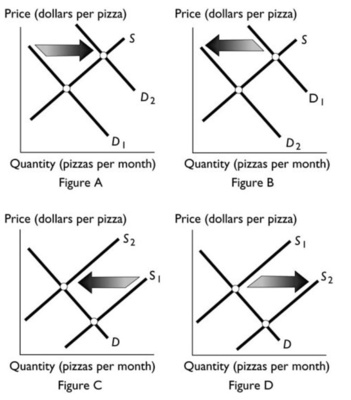
Answer
-
Figure B
-
Figure C
-
Figure A
-
Figure D
-
Both Figures A and C
Want to create your own Quizzes for free with GoConqr? Learn more.