28255362
Descripción
Test por Vishakha Achmare, actualizado hace más de 1 año
|
|
Creado por Vishakha Achmare
hace casi 5 años
|
|
Pregunta 1
Pregunta
Regression analysis is a form of predictive modelling technique which investigates the relationship between a dependent and independent variable.
Respuesta
-
True
-
False
Pregunta 2
Pregunta
Linear regression is a basic and commonly used type of predictive analysis which usually works on continuous data.
Respuesta
-
True
-
False
Pregunta 3
Pregunta
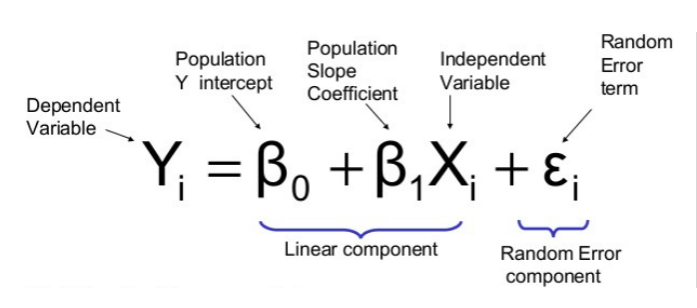
Explain the equation: Y(predicted) = (β1*x + βo) + Error value
Respuesta
-
write your answers down
-
check them later
Pregunta 4
Respuesta
-
write your answer down
-
check time later
Pregunta 5
Pregunta
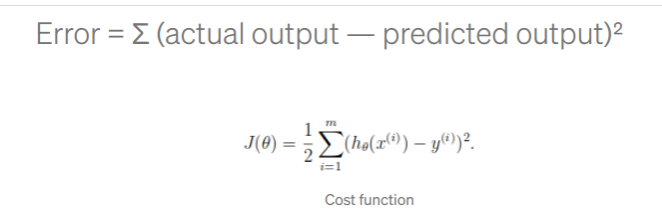
The main goal of Gradient descent is to minimize the cost value. i.e. min J(θo, θ1)
Respuesta
-
True
-
False
Pregunta 6
Pregunta
Choosing a perfect learning rate is a very important task as it depends on how large of a step we take downhill during each iteration.
Respuesta
-
True
-
False
Pregunta 7
Pregunta
This general equation is for?
Respuesta
-
Linear Regression
-
Polynomial Regression
Pregunta 8
Pregunta
Advantages of using Polynomial Regression are:
Respuesta
-
Polynomial provides the best approximation of the relationship between the dependent and independent variables.
-
A broad range of functions can be fit under it.
-
Polynomial basically fits a wide range of curvature.
-
All of the above.
Pregunta 9
Pregunta
Disadvantages of using Polynomial Regression are:
Respuesta
-
The presence of one or two outliers in the data can seriously affect the results of the nonlinear analysis.
-
These are too sensitive to the outliers.
-
In addition, there are unfortunately fewer model validation tools for the detection of outliers in nonlinear regression than there are for linear regression.
-
All of the above.
Pregunta 10
Pregunta
simple linear regression is a type of regression analysis where the number of independent variables is ____ and there is a linear relationship between the independent(x) and dependent(y) variable.
Respuesta
-
one
-
two
Pregunta 11
Pregunta
Residual plot helps in analyzing the model using the values of residues. It is plotted between predicted values and residue. Their values are standardized. The distance of the point from 0 specifies how bad the prediction was for that value. If the value is positive, then the prediction is low. If the value is negative, then the prediction is high. 0 value indicates prefect prediction. Detecting residual pattern can improve the model.
Respuesta
-
True
-
False
Pregunta 12
Pregunta
Non-random pattern of the residual plot indicates that the model is,
Respuesta
-
Missing a variable which has significant contribution to the model target
-
Missing to capture non-linearity (using polynomial term)
-
No interaction between terms in model
-
All of the above
Pregunta 13
Pregunta
Characteristics of a residue are:
Respuesta
-
Residuals do not exhibit any pattern
-
Adjacent residuals should not be same as they indicate that there is some information missed by system.
-
All of the above
¿Quieres crear tus propios Tests gratis con GoConqr? Más información.