8517196
Descripción

Test por Tyler Peterson, actualizado hace más de 1 año
|
|
Creado por Tyler Peterson
hace alrededor de 7 años
|
|
Pregunta 1
Pregunta
Which of the following is an example of a nonparametric test?
Respuesta
-
a z test
-
a paired t-test
-
chi-square test
-
confidence interval estimation
Pregunta 2
Pregunta
Which of the following is a statistical procedure used to test hypotheses about the discrepancy between the observed and expected frequencies in two or more nominal categories
Respuesta
-
related samples sign test
-
paired t-test
-
chi-square test
-
all of the above
Pregunta 3
Pregunta
A genetics researcher expects 1:1:1:1 across four groups to align with Mendelian ratios.. If 200 people are tested, then what is the expected frequency for each group?
Respuesta
-
25 people
-
50 people
-
100 people
-
200 people
Pregunta 4
Pregunta
A chi-square goodness-of-fit test shows that the frequencies observed fit well with those that were expected. Hence, the decision was to
Respuesta
-
reject the null hypothesis
-
retain the null hypothesis
-
no decision was made
-
accept the null hypothesis
Pregunta 5
Pregunta
The degrees of freedom for a chi-square goodness-of-fit test are [k=# categories, n=sample size]
Respuesta
-
k-1
-
n-1
-
(k1 - 1)(k2 - 1)
-
(k - 1)(n - 1)
Pregunta 6
Pregunta
As a general rule, the larger the degrees of freedom for a chi-square test
Respuesta
-
the smaller the critical value will be
-
the larger the critical value will be
-
the smaller the level of significance will be
-
the larger the level of significance will be
Pregunta 7
Pregunta
A researcher conducts a chi-square goodness-of-fit test in which k = 5 (k=# categories). What is the critical value for this test at a .05 level of significance?
Respuesta
-
4
-
5
-
9.49
-
11.07
Pregunta 8
Pregunta
A researcher conducts a chi-square goodness-of-fit test in which k = 3 and x (?) = 4.32. What is the decision for this test at a .05 level of significance?
Respuesta
-
Retain the null hypothesis
-
Reject the null hypothesis
-
There is not enough information to answer this question.
Pregunta 9
Pregunta
A chi-square goodness-of-fit test leads to a decision to retain the null hypothesis. Which of the following correctly explains this decision?
Respuesta
-
frequencies observed were significantly different from frequencies expected at each level of the categorical variable
-
frequencies observed were significantly different from frequencies expected across the levels of the categorical variable
-
frequencies observed were significantly different from frequencies expected within and between expected frequencies
-
Frequencies observed were statistically similar to the frequencies expected at each level of the categorical variable
Pregunta 10
Pregunta
When computing a chi-square goodness-of-fit test for a 2 x 2 table, the frequency expected in a given cell should never be less than
Respuesta
-
the sample size
-
the number of cells
-
the frequency observed
-
five
Pregunta 11
Pregunta
The degrees of freedom for a chi-square test for independence test are [k are categories, n are sample size]
Respuesta
-
k - 1
-
n - 1
-
(k1 - 1)(k2 - 1)
-
(k - 1)(n - 1)
Pregunta 12
Pregunta
A researcher tests whether levels of education and income levels are related. In this study, he observes the following frequencies. If he computes a chi-square test for independence at a .05 level of significance, then what is the decision for this test?
Education Level
High School
Bachelor's Degree
Graduate Degree
Low Income
22
8
5
High Income
8
12
28
Respuesta
-
Education and income level are related
-
Education and income level are not related
-
Education and income level are independent
-
Both B and C are appropriate
Pregunta 13
Pregunta
To compute the expected frequencies for a chi-square test for independence, we use which of the following formulas?
Respuesta
-
k - 1
-
p(n)
-
(row total + column total)/grand total
-
(row total * column total)/grand total
Pregunta 14
Pregunta
If the expected frequencies equal to observed frequencies for a chi-square test for independence, what do we conclude?
Respuesta
-
the degrees of freedom for the test are equal to 0
-
the test statistic value is equal to 0
-
the frequencies observed fit well with the frequencies expected
-
both B and C
Pregunta 15
Pregunta
A researcher conducts two chi-square tests. The 2 2 chi-square was 2 = 3.82. The 2 3 chi-square was 2 = 5.02. Which chi-square test resulted in a decision to reject the null hypothesis at a .05 level of significance?
Respuesta
-
A) the 2 2 chi-square
-
B) the 2 3 chi-square
-
C) both chi-square tests results in a decision to reject the null hypothesis
-
D) none; both chi-square tests result in a decision to retain the null hypothesis
Pregunta 16
Pregunta
When assumptions regarding expected cell counts are not met, an alternative test to the chi-square test is:
Respuesta
-
McNemar’s test.
-
The Goodness of Fit test.
-
The Sign test.
-
Fisher’s Exact test.
Pregunta 17
Pregunta
17. The chi-square test assumes independence between observations. When the design is matched and we wish to compare two dichotomous variables, which test is appropriate?
Respuesta
-
A) McNemar’s test.
-
B) The Goodness of Fit test.
-
C) The Related Sample Sign test.
-
D) Fisher’s Exact test.
Pregunta 18
Pregunta
18. For an analysis of variance, the term “one-way” refers to
Respuesta
-
A) the number of factors in the design
-
B) the number of statistical tests in the design
-
C) the number of ways that the data can be analyzed
-
D) the direction that traffic should follow on a road
Pregunta 19
Pregunta
19. The term “between-subjects” refers to
Respuesta
-
A) observing the same participants in each group
-
B) observing different participants one time in each group
-
C) the type of post hoc test conducted
-
D) the type of effect size estimate measured
Pregunta 20
Pregunta
20. A lowercase k is used to denote
Respuesta
-
A) the number of groups in a study
-
B) the number of participants in a study
-
C) the number of levels of the factor in a study
-
D) both A and C
Pregunta 21
Pregunta
21. The source of variability associated with error variance in the one-way between-subjects ANOVA is called
Respuesta
-
A) between-groups variability
-
B) within-groups variability
-
C) degrees of freedom
-
D) both A and B
Pregunta 22
Pregunta
22. Without changing the value of error variance, the ________ the between-groups variability, the more likely we are to reject the null hypothesis.
Respuesta
-
A) larger
-
B) smaller
-
C) more homogeneous
-
D) less spread
Pregunta 23
Pregunta
23. What is the minimum number of groups that can be observed using the one-way between-subjects ANOVA design?
Respuesta
-
1
-
2
-
3
-
4
Pregunta 24
Pregunta
24. A researcher notes that the variability attributed to difference between group means is quite large. Which source of variation is the researcher referring to?
Respuesta
-
A) between-persons
-
B) within-groups
-
C) between-groups
-
D) error
Pregunta 25
Pregunta
25. ANOVA stands for,
Respuesta
-
A) analysis of variety
-
B) analysis of variable attributes
-
C) analysis of variance
-
D) association of novel operating variable analyses
Pregunta 26
Pregunta
26. The degrees of freedom for the between-groups variability is called
Respuesta
-
A) degrees of freedom numerator
-
B) degrees of freedom denominator
-
C) degrees of freedom between-groups
-
D) both A and C
Pregunta 27
Pregunta
27. The degrees of freedom for error is called
Respuesta
-
A) degrees of freedom error
-
B) degrees of freedom denominator
-
C) degrees of freedom within-groups
-
D) all of the above
Pregunta 28
Pregunta
28. A researcher compares differences in creatinine between participants in a three treatment groups. If she observes 15 participants in each group, then what are the degrees of freedom for the one-way between-subjects ANOVA?
Respuesta
-
A) (2, 12)
-
B) (3, 43)
-
C) (2, 42)
-
D) (3, 12)
Pregunta 29
Pregunta
29. A researcher conducts a study in which k = 5 and N = 80. What are the degrees of freedom between-groups for the one-way between-subjects ANOVA?
Respuesta
-
A) 4
-
B) 5
-
C) 75
-
D) 395
Pregunta 30
Pregunta
30. A researcher assigned participants (n = 8 per group) to three dose groups. Different participants were assigned to each group and then assessed for a specific biomarker. What is the critical value for the one-way between-subjects ANOVA at a .05 level of significance?
Respuesta
-
A) 3.07
-
B) 3.44
-
C) 3.47
-
D) 4.32
Pregunta 31
Pregunta
31. Which of the following is an assumption for computing a one-way between-subjects ANOVA?
Respuesta
-
A) The population being sampled from is normally distributed.
-
B) Participants were selected to participate using a random procedure.
-
C) One observation has no effect on the likelihood of another observation.
-
D) all of the above
Pregunta 32
Pregunta
32. Computing a one-way between-subjects ANOVA is appropriate when
Respuesta
-
A) different participants are observed one time in each of two or more groups for one factor
-
B) the same participants are observed in each of two or more groups for one factor
-
C) the levels of one or more factors are manipulated
-
D) all of the above
Pregunta 33
Pregunta
33. A researcher divides participants into groups that will engage in low, moderate, or intense levels of exercise. The total calories consumed by participants following the exercise are then recorded. What type of statistical design is appropriate for this study?
Respuesta
-
A) a related samples t test
-
B) a two-independent sample t test
-
C) a one-way between-subjects ANOVA
-
D) both B and C
Pregunta 34
Pregunta
34. Homogeneity of variance is an assumption for the one-way between-subjects ANOVA. What does this assumption mean?
Respuesta
-
A) that the population being sampled from is normally distributed
-
B) that participants are randomly selected to participate in a sample
-
C) that the variance is equal in each population from which samples are selected
-
D) that one observation has no effect on the likelihood of another observation
Pregunta 35
Pregunta
35. A researcher randomly assigned 16 rodents to experience one of four levels of shock (n = 4 per group) following the illumination of a visual cue. If SSB = 24 and SSW = 48, then what was the decision at a .05 level of significance for a one-way between-subjects ANOVA?
Respuesta
-
A) Reject the null hypothesis.
-
B) Retain the null hypothesis.
-
C) There is not enough information to answer this question.
-
D) Do not reject the null hypothesis.
Pregunta 36
Pregunta
36. A researcher assigns 21 subjects to 3 treatment groups. An equal number of participants are assigned to each group. If F = 4.08 for this study, then what was the decision at a .05 level of significance for a one-way between-subjects ANOVA?
Respuesta
-
A) Reject the null hypothesis.
-
B) Retain the null hypothesis.
-
C) There is not enough information to answer this question.
-
D) Do not reject the null hypothesis
Pregunta 37
Pregunta
37. A researcher conducts two studies on self-perception. In Study 1, 24 participants rate how positively they view themselves (on a 5-point scale) in one of three groups (n = 8 per group). In Study 2, the researcher conducts a similar study, except that k = 3 and n = 8. If SSB = 28 and SSE = 42 in both studies, then in which study will the decision be to reject the null hypothesis at a .05 level of significance for a one-way between-subjects ANOVA?
Respuesta
-
A) Study 1
-
B) Study 2
-
C) both
-
D) none
Pregunta 38
Pregunta
38. A researcher computes the following one-way between-subjects ANOVA table. State the decision at a .05 level of significance. (Hint: Complete the table first.)
Source of Variation
SS
df
MS
F
Between groups
32
4
Within groups (error)
45
Total
122
Respuesta
-
A) Reject the null hypothesis.
-
B) Retain the null hypothesis.
-
C) Accept the null hypothesis.
-
D) There is not enough information to answer this question.
Pregunta 39
Pregunta
39. A researcher computes the following one-way between-subjects ANOVA table for a study where k = 3 and n = 12. State the decision at a .05 level of significance. (Hint: Complete the table first.)
Source of Variation
SS
df
MS
F
Between groups
120
Within groups (error)
Total
780
Respuesta
-
A) Reject the null hypothesis.
-
B) Retain the null hypothesis.
-
C) Accept the null hypothesis.
-
D) There is not enough information to answer this question.
Pregunta 40
Pregunta
40. In a study with four groups and 10 participants in each group, the sum of squares for the between-groups source of variation is 60. What is the value for the mean square between-groups in this study?
Respuesta
-
A) 10
-
B) 15
-
C) 20
-
D) 1.67
Pregunta 41
Pregunta
41. When the variability attributed to between-groups is equal to the variability attributed to error, then the value of the test statistic for a one-way between-subjects ANOVA is,
Respuesta
-
A) Equal to 0.
-
B) Equal to 1.
-
C) Significant at any sample size.
-
D) Undefined in that the test statistic cannot be computed in this case.
Pregunta 42
Pregunta
42. Following a significant one-way between-subjects ANOVA in which k > 2, what is the next appropriate step?
Respuesta
-
A) Summarize the data; no further tests are required.
-
B) Interpret the data; no further tests are required.
-
C) Conduct post hoc tests.
-
D) both A and B
Pregunta 43
Pregunta
43. Which of the following is not a post hoc test for a one-way between-subjects ANOVA?
Respuesta
-
A) F test for equal variance
-
B) Fisher's LSD test
-
C) Tukey's HSD test
-
D) Bonferroni test
Pregunta 44
Pregunta
44. Which of the following post hoc tests is associated with the greatest power to detect an effect?
Respuesta
-
A) Schaffé test
-
B) Tukey's HSD test
-
C) Bonferroni test
-
D) Fisher's LSD test
Pregunta 45
Pregunta
45. Which of the following post hoc tests is associated with the least power to detect an effect?
Respuesta
-
A) Fisher's LSD test
-
B) Tukey's HSD test
-
C) Studentized Newman-Keuls
-
D) None; each post hoc test is associated with the same power to detect an effect.
Pregunta 46
Pregunta
46. Post hoc tests are computed
Respuesta
-
A) Prior to conducting a hypothesis test.
-
B) To determine which set of degrees of freedom can be attributed to the variability between-groups.
-
C) Following a significant ANOVA test to make pairwise comparisons.
-
D) to determine if groups means differ, even for tests in which the decision is to retain the null hypothesis.
Pregunta 47
Pregunta
47. The following is a summary of a one-way between-subjects ANOVA: F(2, 37) = 3.42, p < .05. How many pairwise comparisons need to be made for this ANOVA result?
Respuesta
-
A) 2
-
B) 3
-
C) 4
-
D) 12
Pregunta 48
Pregunta
48. The following is a summary of a one-way between-subjects ANOVA: F(2, 37) = 3.42, p < .05. How many participants were observed in this study?
Respuesta
-
A) 12
-
B) 37
-
C) 40
-
D) 39
Pregunta 49
Pregunta
49. The Kruskal-Wallis test is the nonparametric analog to the
Respuesta
-
A) one sample z test for a single population mean.
-
B) two independent samples t test.
-
C) one-way ANOVA F test.
-
D) paired t test.
Pregunta 50
Pregunta
50. The Kruskal-Wallis test can be used to:
Respuesta
-
A) compare a ranked outcome by race group (W, AA, Other).
-
B) compare a skewed continuous variable by a categorical variable with four levels.
-
C) compare an interval/ratio variable across more than two groups
-
D) All of the above
Pregunta 51
Pregunta
51. The Kruskal-Wallis test relies on:
Respuesta
-
A) ranked data
-
B) raw data
-
C) mean values
-
D) all of the above
Pregunta 52
Pregunta
52. The null hypothesis for the Kruskal-Wallis test is
Respuesta
-
A) the difference in ranks for the groups do not differ
-
B) the median values for the groups do not differ
-
C) the sum of the ranks in each group do not differ
-
D) the sum of the ranks in each group do differ
Pregunta 53
Pregunta
53. The test statistic used for the Kruskal-Wallis test follows which distribution?
Respuesta
-
A) the chi-square distribution with (k-1) degrees of freedom
-
B) the t distribution with (k-1) degrees of freedom
-
C) the F distribution with (1, k-1) degrees of freedom
-
D) the standard normal distribution
Pregunta 54
Pregunta
54. A post-hoc test that can be used following a significant Kruskal-Wallis test is:
Respuesta
-
A) Tukey’s LSD test
-
B) Bono U2 test
-
C) Dunns Q test
-
D) Duncin’s HSD test
Pregunta 55
Pregunta
55. The correlation coefficient is used to measure the ________ and ________ of the linear relationship between two factors.
Respuesta
-
A) date; time
-
B) mean; variance
-
C) significance; effect size
-
D) strength; direction
Pregunta 56
Pregunta
56. The correlation coefficient ranges from -1.0 to +1.0, with values closer to ±1.0 indicating
Respuesta
-
A) a more positive relationship between two factors
-
B) a stronger relationship between two factors
-
C) that two factors are less likely to be related
-
D) that the correlation is due to outliers
Pregunta 57
Pregunta
57. Which of the following indicates the strongest correlation?
Respuesta
-
A) r = -0.57
-
B) r = +0.78
-
C) r = -0.90
-
D) r = +0.88
Pregunta 58
Pregunta
58. The following graphs display the data points for two linear correlations. Based on the information provided in these graphs, ________ displays a negative correlation and ________ displays a stronger correlation.
Respuesta
-
A) Graph A; Graph B
-
B) Graph B; Graph A
-
C) Graph A; Graph A
-
D) Graph B; Graph B
Pregunta 59
Pregunta
59. The numerator of the correlation coefficient measures the extent to which two variables
Respuesta
-
A) vary together
-
B) vary independently
-
C) covary
-
D) both A and C
Pregunta 60
Pregunta
60. A researcher measures the following correlation between cups of coffee consumed daily and daily work schedule. Which description best explains the relationship between these two factors?
Respuesta
-
A) The more a person works, the more coffee he or she tends to drink.
-
B) The less a person works, the more coffee he or she tends to drink.
-
C) The more a person works, the less coffee he or she tends to drink.
-
D) No linear pattern is evident.
Pregunta 61
Pregunta
61. The denominator of the correlation coefficient measures the extent to which two variables
Respuesta
-
A) vary together
-
B) vary independently
-
C) covary
-
D) both A and C
Pregunta 62
Pregunta
62. The correlation coefficient measures the extent to which changes in one factor are _______ in a second factor.
Respuesta
-
A) related to changes
-
B) causing changes
-
C) causing variability
-
D) all of the above
Pregunta 63
Pregunta
63. A researcher measures the relationship between narcissism and willingness to help. If SSXY = 240, SSX = 320, and SSY = 410, then what is the value of the correlation coefficient?
Respuesta
-
A) 0.002
-
B) 0.02
-
C) 0.66
-
D) 0.69
Pregunta 64
Pregunta
64. A researcher measures the relationship between two variables, X and Y. If SSXY = 340 and SSXSSY = 320,000, then what is the value of the correlation coefficient?
Respuesta
-
A) 0.32
-
B) 0.34
-
C) 0.60
-
D) almost a zero correlation
Pregunta 65
Pregunta
65. Suppose a correlation is computed in each of two samples. If the value of SSXY is the same in each sample, and √SSXSSY is larger in Sample 1, then in which sample will the value of the correlation coefficient be larger?
Respuesta
-
A) Sample 1
-
B) Sample 2
-
C) None; the correlation coefficient will be the same in both samples.
-
D) There is not enough information to answer this question.
Pregunta 66
Pregunta
66. A researcher measures the following correlation: r = -0.21. What is the value of the coefficient of determination?
Respuesta
-
A) 0.04
-
B) -0.04
-
C) 0.42
-
D) -0.42
Pregunta 67
Pregunta
67. The assumption that there is an equal variance or scatter of data points dispersed along the regression line is referred to as
Respuesta
-
A) normality
-
B) linearity
-
C) homoscedasticity
-
D) restriction of range
Pregunta 68
Pregunta
68. What is the problem with the following data for computing a correlation?
Factor 1
Factor 2
3
3
3
3
3
3
3
3
3
3
Respuesta
-
A) The correlation coefficient will equal 0 because it violates the assumption of normality.
-
B) The correlation coefficient will equal 1.0 because it violates the assumption of normality.
-
C) The correlation coefficient will equal 0 because it violates the assumption of linearity.
-
D) The correlation coefficient will equal 1.0 because it violates the assumption of linearity
Pregunta 69
Pregunta
69. The normality assumption states that the population of X and Y scores form a bivariate (“two variable”) normal distribution, such that
Respuesta
-
A) the population of X and Y scores are normally distributed
-
B) for each X score, the distribution of Y scores is normally distributed
-
C) for each Y score, the distribution of X scores is normally distributed
-
D) all of the above
Pregunta 70
Pregunta
70. Which of the following is the assumption that the best way to describe the pattern of data is using a straight line?
Respuesta
-
A) normality
-
B) linearity
-
C) homoscedasticity
-
D) restriction of range
Pregunta 71
Pregunta
71. Which of the following is a limitation for interpreting a correlation?
Respuesta
-
A) Correlations do not demonstrate cause-and-effect.
-
B) Outliers can change the direction and/or strength of the correlation.
-
C) Conclusions should not be drawn beyond the range of scores measured.
-
D) all of the above
Pregunta 72
Pregunta
72. An unanticipated variable not accounted for in a research study that could be causing or associated with observed changes in one or more measured variables is called
Respuesta
-
A) reverse causality
-
B) restriction of range
-
C) a confound variable
-
D) homoscedasticity
Pregunta 73
Pregunta
73. A researcher observes a correlation of values from 2 to 10 points and draws conclusions about the full range of values in the population from 0 to 21 points. Which limitation for correctly interpreting a correlation coefficient did the researcher violate?
Respuesta
-
A) reverse causality
-
B) restriction of range
-
C) a confound variable
-
D) homoscedasticity
Pregunta 74
Pregunta
74. Outliers can change the _____ of a correlation.
Respuesta
-
A) direction
-
B) strength
-
C) sign (+, -)
-
D) all of the above
Pregunta 75
Pregunta
75 A correlation coefficient can ______ demonstrate cause.
Respuesta
-
A) always
-
B) never
-
C) mostly
-
D) intermittently
Pregunta 76
Pregunta
76. The Spearman rank-order correlation coefficient is a measure of the direction and strength of the linear relationship between two ________ variables.
Respuesta
-
A) nominal
-
B) ordinal
-
C) interval
-
D) ratio
Pregunta 77
Pregunta
77. The appropriate correlation coefficient for measuring the direction and strength of the linear relationship between two ranked or ordinal variables is
Respuesta
-
A) the Spearman correlation coefficient
-
B) the point-biserial correlation coefficient
-
C) the phi correlation coefficient
-
D) none of the above
Pregunta 78
Pregunta
78. A researcher measures the correlation in rankings for a sample of restaurants and consumers' rankings of their favorite restaurants. If D2 = 96 and n = 12, then what is the value of the correlation coefficient?
Respuesta
-
A) 0.07
-
B) 0.34
-
C) 0.66
-
D) 0.94
Pregunta 79
Pregunta
79. A researcher measures the correlation of the time it take participants to complete two tasks purported to measure the same cognitive skill. Participant times are converted to ranks from fastest to slowest. If D2 = 165 and n = 20, then what is the decision for this correlation test?
Respuesta
-
A) Retain the null hypothesis.
-
B) Reject the null hypothesis.
-
C) There is not enough information to answer this question.
Pregunta 80
Pregunta
80. To summarize correlations, we report:
Respuesta
-
A) the strength of the correlation
-
B) the direction of the correlation
-
C) the p value
-
D) all of the above
Pregunta 81
Pregunta
81. Which of the following would not be reported for a correlation?
Respuesta
-
A) the sample size
-
B) the coefficient of determination
-
C) the critical values for each test
-
D) the strength and direction of the correlation
Pregunta 82
Pregunta
82. Select the description below that identifies the following correlation: r = .28, p < .01.
Respuesta
-
A) the correlation is positive
-
B) the correlation is statistically significant
-
C) the coefficient of determination is .08
-
D) all of the above
Pregunta 83
Pregunta
83. A researcher measures the extent to which time spent watching educational preschool television programming predicts success in school. Which variable is the outcome variable in this example?
Respuesta
-
A) educational preschool television
-
B) type of television programming
-
C) success in school
-
D) time spent in school
Pregunta 84
Pregunta
84. A researcher measures the extent to which the speed at which people eat (in minutes) predicts calorie intake (in kilocalories). Which factor is the predictor variable in this example?
Respuesta
-
A) the speed at which people eat
-
B) calorie intake
-
C) minutes and kilocalories
-
D) all of the above
Pregunta 85
Pregunta
86. Which of the following is used to determine the linear equation that “best fits” a set of data points?
Respuesta
-
A) correlational analysis
-
B) analysis of variance
-
C) analysis of regression
-
D) method of least squares
Pregunta 86
Pregunta
85. Linear regression describes the extent to which _______ predicts ________.
Respuesta
-
A) X; Y
-
B) the predictor variable; the outcome variable
-
C) the known variable; the to-be-predicted variable
-
D) all of the above
Pregunta 87
Pregunta
87. Which of the following is used to determine the significance of predictions made by a best fitting linear equation?
Respuesta
-
A) correlational analysis
-
B) analysis of variance
-
C) analysis of regression
-
D) method of least squares
Pregunta 88
Pregunta
88. A researcher reports the following equation for a best-fitting straight line to a set of data points: Y = -1.01X + 3.24. Which value is the y-intercept?
Respuesta
-
A) Y
-
B) X
-
C) ñ1.01
-
D) 3.24
Pregunta 89
Pregunta
89. A researcher reports the following equation for a best-fitting straight line to a set of data points: Y = 0.48X + 12.03. Which value is the slope?
Respuesta
-
A) Y
-
B) 0.48
-
C) 12.03
-
D) The slope is not given in this equation
Pregunta 90
Pregunta
90. If SSXY = -16.32 and SSX = 40.00 for a set of data points, then what is the value of the slope for the best-fitting linear equation?
Respuesta
-
A) -0.41
-
B) -2.45
-
C) positive
-
D) There is not enough information; you would also need to know the value of SSY.
Pregunta 91
Pregunta
91. If b = -0.57, My = 2.75, and Mx = 5.25 for a set of data points, then what is the value of the y-intercept for the best-fitting linear equation?
Respuesta
-
A) 0.24
-
B) 11.68
-
C) -0.24
-
D) 5.74
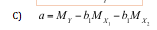
Pregunta 92
Pregunta
92. Which of the following is not needed to compute the y-intercept using the method of least squares?
Respuesta
-
A) My
-
B) Mx
-
C) Mxy
-
D) the slope
Pregunta 93
Pregunta
93. Which of the following is not needed to compute the slope using the method of least squares?
Respuesta
-
A) SSY
-
B) SSX
-
C) SSXY
Pregunta 94
Pregunta
94. A researcher reports the following regression equation for two variables, X and Y: Y = 5.10X - 1.50. If X = 2.30, then what is the value of Y-hat?
Respuesta
-
A) 10.23
-
B) 11.73
-
C) 13.23
Pregunta 95
Pregunta
95. Using an analysis of regression, the variability in Y that is predicted by X is measured by the
Respuesta
-
A) regression variation
-
B) residual variation
-
C) correlation coefficient
-
D) coefficient of determination
Pregunta 96
Pregunta
96. Using an analysis of regression, the variability in Y that is associated with error is measured by the
Respuesta
-
A) regression variation
-
B) residual variation
-
C) correlation coefficient
-
D) coefficient of determination
Pregunta 97
Pregunta
97. Both sources of variation in an analysis of regression measure the variability in
Respuesta
-
A) X and Y
-
B) X only
-
C) Y only
Pregunta 98
Pregunta
98. The more that the variability in ____ is associated with regression variation, the more likely it is that X predicts Y.
Respuesta
-
A) XY
-
B) X
-
C) Y
-
D) all of the above
Pregunta 99
Pregunta
99. Which of the following statements is true regarding the sources of variation present in an analysis of regression?
Respuesta
-
A) Regression variation measures variability in X, whereas residual variation measures variability in Y.
-
B) The closer that data points fall to the regression line, the more the variance in Y will be attributed to regression variation.
-
C) There are three sources of variation in an analysis of regression: regression variance, residual variance, and error variance.
-
D) When most of the variability in Y is associated with residual variation, then X predicts Y.
Pregunta 100
Pregunta
100. The degrees of freedom associated with regression variation are equal to
Respuesta
-
A) the number of predictor variables
-
B) the number of predictor variables minus one
-
C) n -1
-
D) n - 2
Pregunta 101
Pregunta
101. The degrees of freedom associated with residual variation are equal to
Respuesta
-
A) the number of predictor variables
-
B) the number of predictor variables minus one
-
C) n - 1
-
D) n - 2
Pregunta 102
Pregunta
102. If the coefficient of determination is 0.32 and SSY = 150, then what is the sum of squares residual for an analysis of regression?
Respuesta
-
A) 48
-
B) 102
-
C) 150
-
D) There is not enough information to answer this question.
Pregunta 103
Pregunta
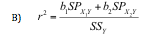
103. If the coefficient of determination is 0.30 and the sum of squares regression for an analysis of regression is 210, then what is the value of SSY?
Respuesta
-
A) 210
-
B) 300
-
C) 490
-
D) 700
Pregunta 104
Pregunta
104. In a sample of 22 participants, suppose we conduct an analysis of regression with one predictor variable. If F = 4.07, then what is the decision for this test at a .05 level of significance?
Respuesta
-
A) X significantly predicts Y.
-
B) X does not significantly predict Y.
-
C) There is not enough information to answer this question.
Pregunta 105
Pregunta
105. A researcher computes the following analysis of regression table. Based on the data given, what is the decision for this test at a .05 level of significance? (Note: Complete the table first.)
Source of Variation
SS
df
MS
F
Regression
1
28
Residual
Total
118
19
Respuesta
-
A) X significantly predicts Y.
-
B) X does not significantly predict Y.
-
C) There is not enough information to answer this question.
Pregunta 106
Pregunta
106. An estimate of the standard deviation or distance that data points fall from the regression line is measured by the
Respuesta
-
A) sum of squares
-
B) standard error of estimate
-
C) criterion variable
-
D) predictor variable
Pregunta 107
Pregunta
107. The standard error of estimate is used as a measure of the ________ in predictions using the equation of a regression line.
Respuesta
-
A) linearity
-
B) appropriateness
-
C) accuracy
-
D) certainty
Pregunta 108
Pregunta
108. What is the computation for the standard error of estimate?
Respuesta
-
A) the square root of the mean square regression
-
B) the square root of the mean square residual
-
C) the mean square regression, squared
-
D) the mean square residual, squared
Pregunta 109
Pregunta
109. A researcher computes a perfect negative correlation, in which each data point falls exactly on the regression line. In this example, the value of the standard error of estimate will be
Respuesta
-
A) less than 0
-
B) greater than 0
-
C) equal to 0
-
D) There is not enough information to answer this question
Pregunta 110
Pregunta
110. A researcher computes an analysis of regression in which MSE = 0.82. What is the value of se in this example?
Respuesta
-
A) 0.67
-
B) 0.82
-
C) 0.91
-
D) There is not enough information to answer this question.
Pregunta 111
Pregunta
111. A researcher computes the following analysis of regression table. Based on the data given, what is the value of the standard error of estimate? (Note: Complete the table first.)
Source of Variation
SS
Df
MS
F
Regression
28
1
5.60
Residual
Total
118
19
Respuesta
-
A) 2.24
-
B) 5.00
-
C) 5.74
-
D) 8.49
Pregunta 112
Pregunta
112. Multiple regression is a statistical method that includes ____ predictor variable(s) in the equation of the regression line.
Respuesta
-
A) zero
-
B) one
-
C) two
-
D) two or more
Pregunta 113
Pregunta
113. A statistical method that includes two or more predictor variables in the equation of a regression line to predict changes in a criterion variable is called
Respuesta
-
A) analysis of variance
-
B) standard error of estimate
-
C) residual regression
-
D) multiple regression
Pregunta 114
Pregunta
114. One key advantage for including multiple predictor variables in the equation of a regression line is that it allows you to
Respuesta
-
A) detect mean differences between groups for each criterion variable
-
B) detect the extent to which two or more predictor variables interact
-
C) show cause-and-effect because many predictor variables are added
-
D) all of the above
Pregunta 115
Pregunta
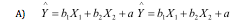
115. Which of the following equations is appropriate for a linear regression with three predictor variables?
Respuesta
-
Y' = bX + a
-
Y' = b1X1 + b2X2 + a
-
Y' = b1X1 + b2X2 + b3X3 + a
-
Y' = b1X1 + b2X2 + b3X3 + b4X4 + a
Pregunta 116
Pregunta
116. For a multiple regression analysis with 2 and 12 degrees of freedom, MS regression is 135 and MS residual is 15. What is the decision for this test?
Respuesta
-
A) reject the null hypothesis; the predictive variability of two predictor factors are significant
-
B) retain the null hypothesis; the predictive variability of two predictor factors are not significant
-
C) reject the null hypothesis; the predictive variability of one predictor factor is significant
-
D) retain the null hypothesis; the predictive variability of one predictor factor is significant
Pregunta 117
Pregunta
117. The value of b1 and b2 are referred to as,
Respuesta
-
A) unstandardized beta coefficients
-
B) standardized beta coefficients
-
C) regression variation
-
D) residual variation
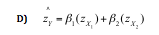
Pregunta 118
Pregunta
118. To standardize the beta coefficients, we first,
Respuesta
-
A) analyze the significance of each data point
-
B) analyze the residual variation
-
C) convert the original data to standardized z scores
-
D) compute the standard error of estimate
Pregunta 119
Pregunta
119. The equation for the standardized regression equation is,
Respuesta
Pregunta 120
Pregunta
120. In addition to evaluating the significance of a multiple regression equation, we also should consider:
Respuesta
-
A) the significance of the residual variability
-
B) the complexity of the correlation coefficient
-
C) the relative contribution of each factor
-
D) the significance of each individual data point
Pregunta 121
Pregunta
121. If F = 2.04 for the relative contribution of one factor, then what is this value when converted to a t statistic?
Respuesta
-
A) 2.04
-
B) 1.43
-
C) 4.16
-
D) The conversion is not possible
Pregunta 122
Pregunta
122. To summarize any type of regression analysis, we report each of the following except the,
Respuesta
-
A) test statistic
-
B) degrees of freedom
-
C) p value
-
D) critical values
Pregunta 123
Pregunta
123. The scores or data points for a regression analysis are typically reported in,
Respuesta
-
A) a scatter plot
-
B) a bar chart
-
C) a pie chart
-
D) all of the above
¿Quieres crear tus propios Tests gratis con GoConqr? Más información.