18606546
| Pregunta | Respuesta |
| FInd the area under the x, y curve | z=trapz(x,y) |
| Plot the integral curve | z=cumtrapz(x,z) plot(x,z) |
| It is good to start every program with these three lines | clear all; close all; clc |
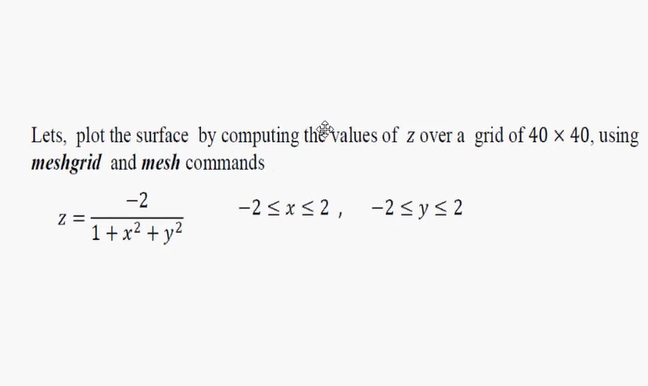
| Difference between mesh and surf | Mesh creates wireframe. Surf creates surface |
| Contour of 3d graph? | contourf(x,y,z) |
| Create a colour plot | imagesc(x,y,z) |
¿Quieres crear tus propias Fichas gratiscon GoConqr? Más información.