20503016
| Pregunta | Respuesta |
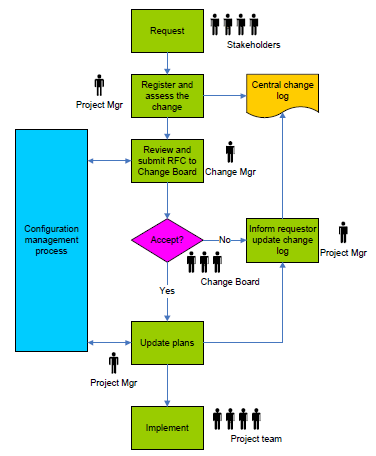
| Flow chart diagram (yes /no nods) graphical representation of processes. use to identify and anticipate problems. plan control quality, and identify risk | |
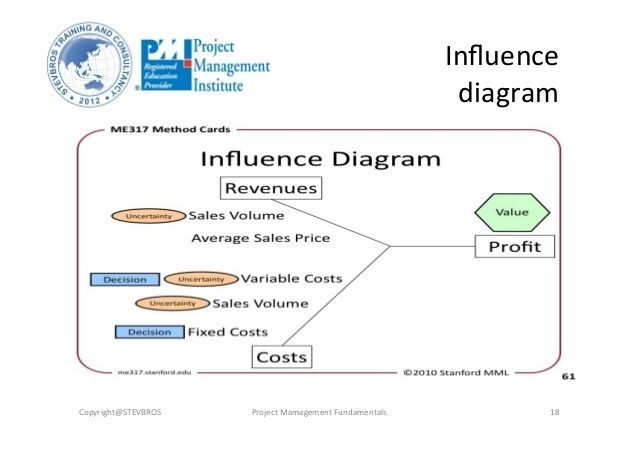
| It represents a situation as a set of outcomes and influences as well as the relationships and effects between them. Used in decision making with uncertain conditions. ojo: it doesn't have numbers but it's a quantitative risk analysis | |
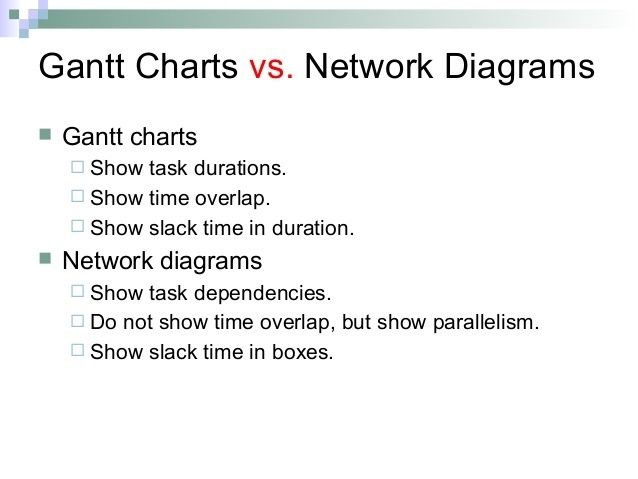
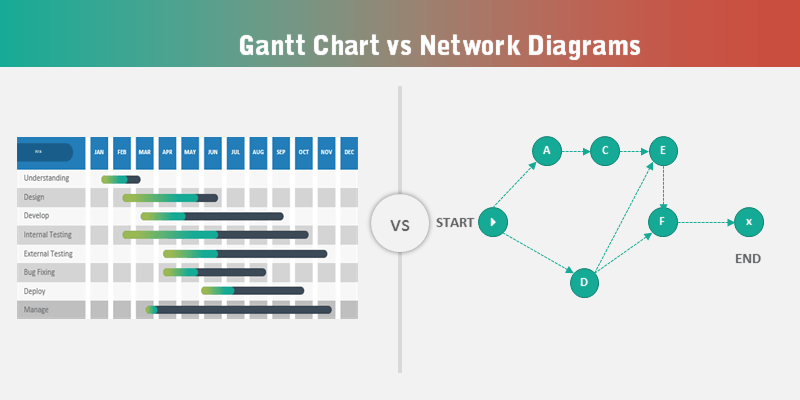
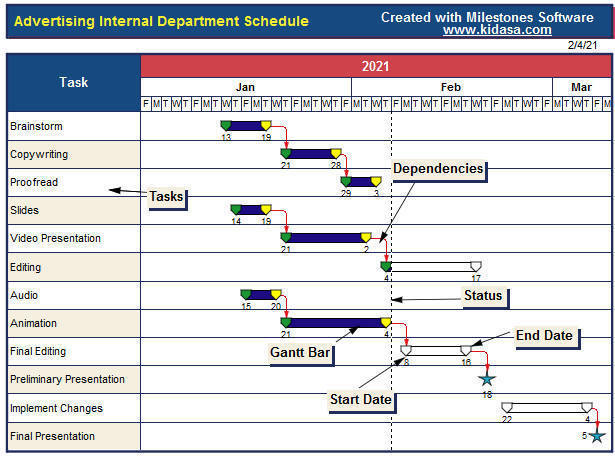
| Milestone Chart: graphical representation of significant points in the project. shows the project schedule at a high-level for executives. develop schedule. it is used along with the bar chart The bar chart can be more detailed and it's used for a specif period since it would be too long. also the bar chart includes the start/end dates | |
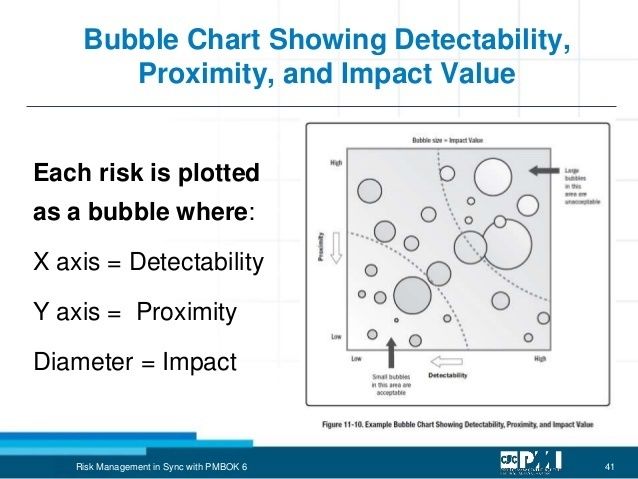
| Bubble chart: graphical chart showing three dimensions: Proximity, detectability and impact value. use to determine the most prevalent errors to focus corrective action. qualitative risk analysis | |
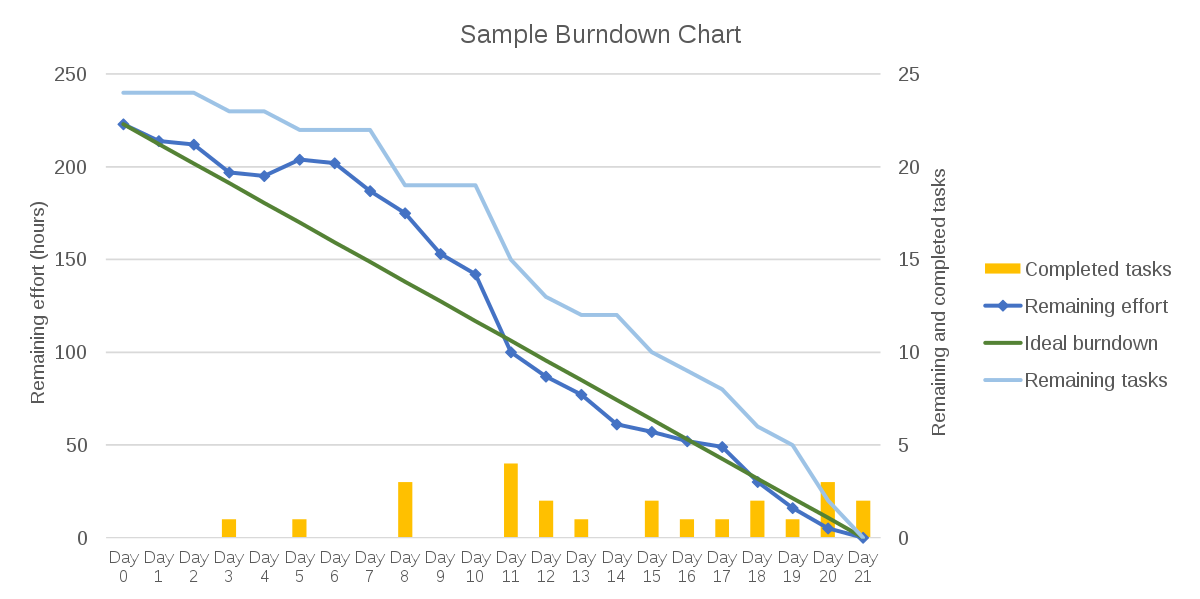
| Tracks work to be completed in the iteration backlog. Use to analyzes variances with respect to an ideal burndown based on commitments. control schedule. |
¿Quieres crear tus propias Fichas gratiscon GoConqr? Más información.