
33857337


| Pregunta | Respuesta |
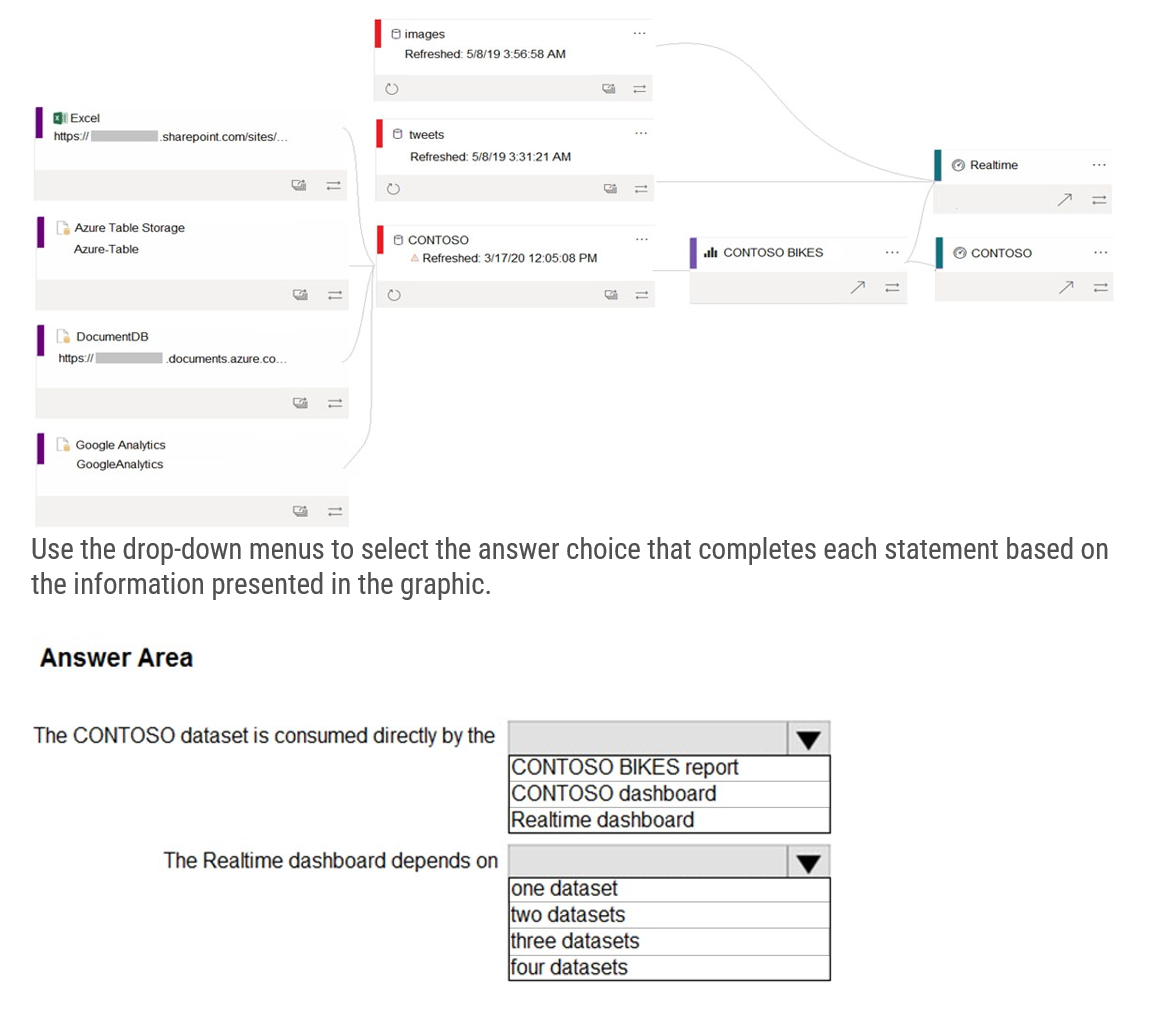
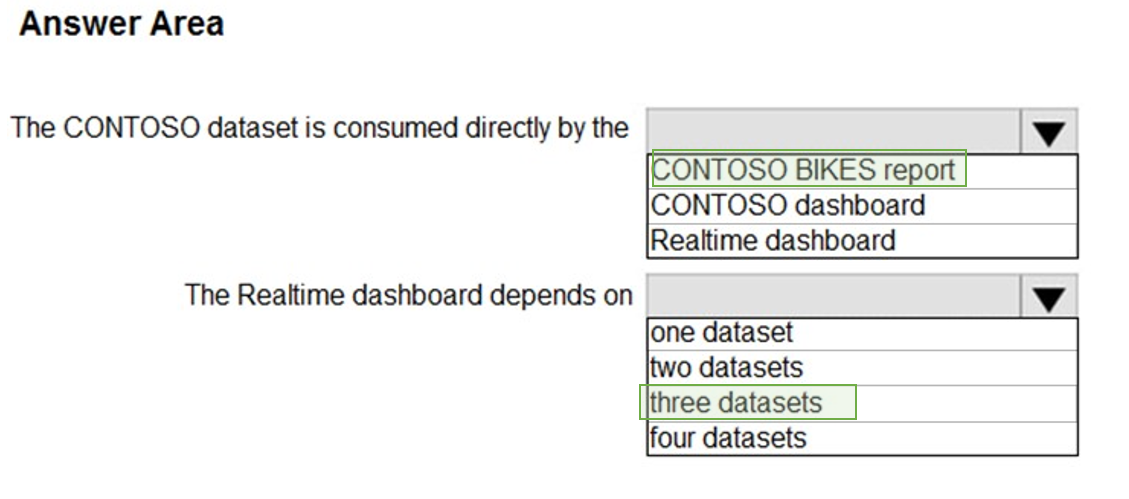
| You have a custom connector that returns ID, From, To, Subject, Body, and Has Attachments for every email sent during the past year. More than 10 million records are returned. You build a report analyzing the internal networks of employees based on whom they send emails to. You need to prevent report recipients from reading the analyzed emails. The solution must minimize the model size. What should you do? • A. Implement row-level security (RLS) so that the report recipients can only see results based on the emails they sent. • B. Remove the Subject and Body columns during the import. • C. From Model view, set the Subject and Body columns to Hidden. | • B. Remove the Subject and Body columns during the import. |
|
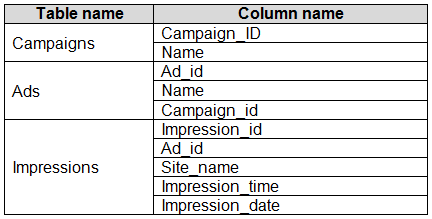
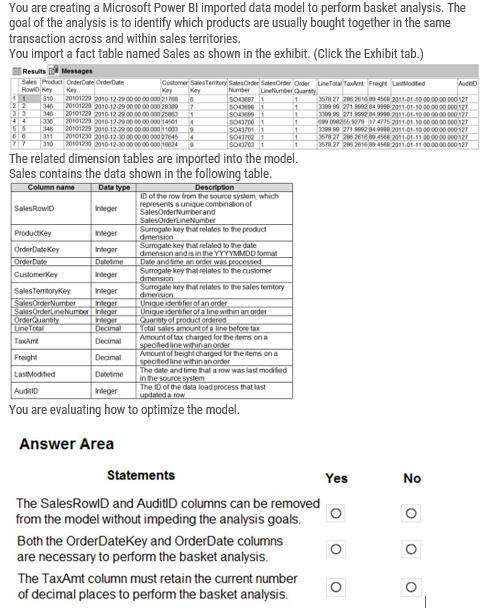
The Impressions table contains approximately 30 million records per month.
You need to create an ad analytics system to meet the following requirements:
✑ Present ad impression counts for the day, campaign, and Site_name. The analytics for the last year are required.
✑ Minimize the data model size.
Which two actions should you perform?
• A. Group the Impressions query in Power Query by Ad_id, Site_name, and Impression_date. Aggregate by using the CountRows function.
• B. Create one-to-many relationships between the tables.
• C. Create a calculated measure that aggregates by using the COUNTROWS function.
• D. Create a calculated table that contains Ad_id, Site_name, and Impression_date.
Image:
1 (binary/octet-stream)
|
• A. Group the Impressions query in Power Query by Ad_id, Site_name, and Impression_date. Aggregate by using the CountRows function. • B. Create one-to-many relationships between the tables. |
| Your company has training videos that are published to Microsoft Stream. You need to surface the videos directly in a Microsoft Power BI dashboard. Which type of tile should you add? • A. video • B. custom streaming data • C. text box • D. web content | D. web content |
| You open a query in Power Query Editor. You need to identify the percentage of empty values in each column as quickly as possible. Which Data Preview option should you select? • A. Show whitespace • B. Column profile • C. Column distribution • D. Column quality | D. Column quality |
| You have a prospective customer list that contains 1,500 rows of data. The list contains the following fields: ✑ First name ✑ Last name ✑ Email address ✑ State/Region ✑ Phone number You import the list into Power Query Editor. You need to ensure that the list contains records for each State/Region to which you want to target a marketing campaign. Which two actions should you perform? • A. Open the Advanced Editor. • B. Select Column quality. • C. Enable Column profiling based on entire dataset. • D. Select Column distribution. • E. Select Column profile. | • C. Enable Column profiling based on entire dataset. • E. Select Column profile. |
|
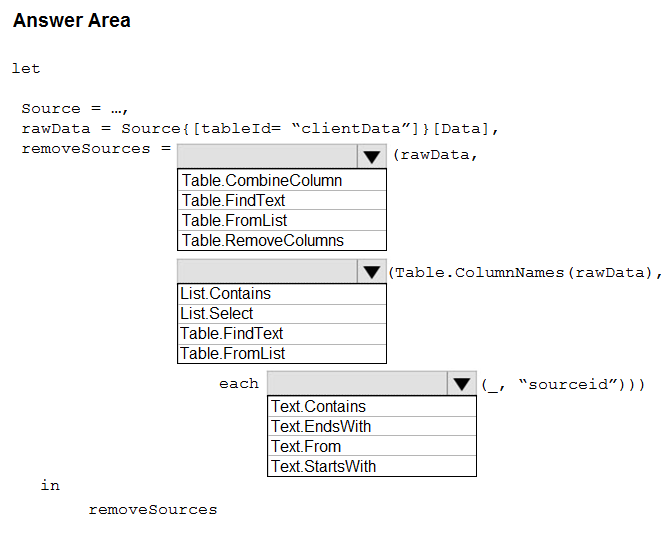
You have an API that returns more than 100 columns. The following is a sample of column names.
1. client_notified_timestamp 2. client_notified_source 3. client_notified_sourceid 4. client_notified_value 5. client_responded_timestamp 6. client_responded_source 7. client_responded_sourceid 8. client_responded_value
You plan to include only a subset of the returned columns.
You need to remove any columns that have a suffix of sourceid.
How should you complete the Power Query M code?
Image:
3 (binary/octet-stream)
|
A) Table.RemoveColumns um Spalten zu löschen B) List.Select um Spalten als Liste auszuwählen C) Text.EndsWith um alle Spalten mit Suffix zu löschen |
|
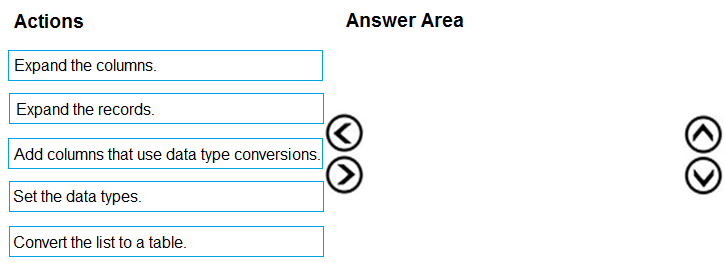
You are building a dataset from a JSON file that contains an array of documents.
You need to import attributes as columns from all the documents in the JSON file. The solution must ensure that date attributes can be used as date hierarchies in
Microsoft Power BI reports.
Which three actions should you perform in sequence? To answer, move the appropriate actions from the list of actions to the answer area and arrange them in the correct order.
Image:
4 (binary/octet-stream)
|
Allgemeines Vorgehen bei json Dateien A) Convert list in table, um eine Tabelle zu erhalten (eine Spalte mit nur "Record") B) Expand the columns, um aus der einen Spalte eine richtige Tabelle zu machen C) Set the data type, um als Datumsspalte zu definieren |
| You import two Microsoft Excel tables named Customer and Address into Power Query. Customer contains the following columns: 1. Customer ID 2. Customer Name 3. Phone 4. Email Address 5. Address ID Address contains the following columns: 1. Address ID 2. Address Line 1 3. Address Line 2 4. City 5. State/Region 6. Country 7. Postal Code The Customer ID and Address ID columns represent unique rows. You need to create a query that has one row per customer. Each row must contain City, State/Region, and Country for each customer. What should you do? • A. Merge the Customer and Address tables. • B. Transpose the Customer and Address tables. • C. Group the Customer and Address tables by the Address ID column. • D. Append the Customer and Address tables. | A. Merge the Customer and Address tables. |
| You have the following three versions of an Azure SQL database: ✑ Test ✑ Production ✑ Development You have a dataset that uses the development database as a data source. You need to configure the dataset so that you can easily change the data source between the development, test, and production database servers from powerbi.com. Which should you do? • A. Create a JSON file that contains the database server names. Import the JSON file to the dataset. • B. Create a parameter and update the queries to use the parameter. • C. Create a query for each database server and hide the development tables. • D. Set the data source privacy level to Organizational and use the ReplaceValue Power Query M function. | B. Create a parameter and update the queries to use the parameter. |
| You have a CSV file that contains user complaints. The file contains a column named Logged. Logged contains the date and time each complaint occurred. The data in Logged is in the following format: 2018-12-31 at 08:59. You need to be able to analyze the complaints by the logged date and use a built-in date hierarchy. What should you do? • A. Change the data type of the Logged column to Date. • B. Apply a transformation to extract the last 11 characters of the Logged column and set the data type of the new column to Date. • C. Create a column by example that starts with 2018-12-31 and set the data type of the new column to Date. • D. Add a conditional column that outputs 2018 if the Logged column starts with 2018 and set the data type of the new column to Whole Number. | C. Create a column by example that starts with 2018-12-31 and set the data type of the new column to Date. |
| You have an Azure SQL database that contains sales transactions. The database is updated frequently. You need to generate reports from the data to detect fraudulent transactions. The data must be visible within five minutes of an update. How should you configure the data connection? • A. Add a SQL statement. • B. Set Data Connectivity mode to DirectQuery. • C. Set the Command timeout in minutes setting. • D. Set Data Connectivity mode to Import. | B. Set Data Connectivity mode to DirectQuery. |
| You have a data model that contains many complex DAX expressions. The expressions contain frequent references to the RELATED and RELATEDTABLE functions. You need to recommend a solution to minimize the use of the RELATED and RELATEDTABLE functions. What should you recommend? • A. Split the model into multiple models. • B. Hide unused columns in the model. • C. Merge tables by using Power Query. • D. Transpose the required columns. | C. Merge tables by using Power Query. |
| You have a large dataset that contains more than 1 million rows. The table has a datetime column named Date. You need to reduce the size of the data model without losing access to any data. What should you do? • A. Round the hour of the Date column to startOfHour. • B. Change the data type of the Date column to Text. • C. Trim the Date column. • D. Split the Date column into two columns, one that contains only the time and another that contains only the date. | D. Split the Date column into two columns, one that contains only the time and another that contains only the date. |
|
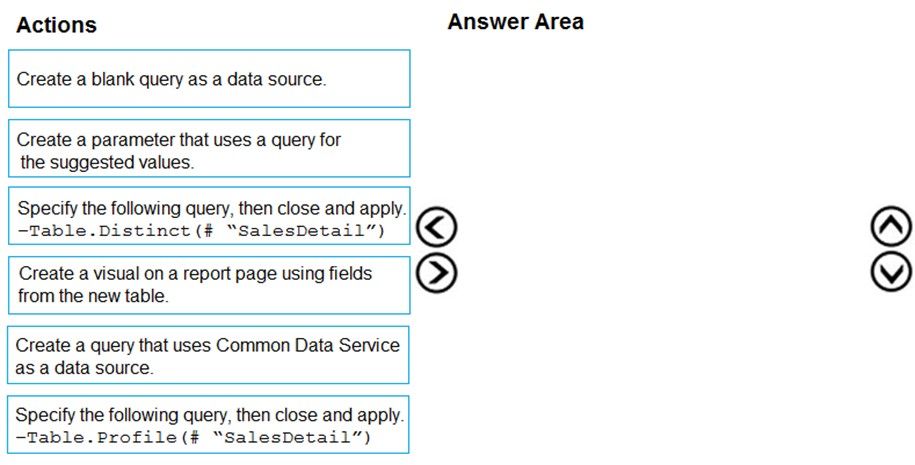
You are modeling data in a table named SalesDetail by using Microsoft Power BI.
You need to provide end users with access to the summary statistics about the SalesDetail data. The users require insights on the completeness of the data and the value distributions.
Which three actions should you perform in sequence?
Image:
5 (binary/octet-stream)
|
1. Create a blank query as data source. 2. Specify the following query, then close and apply. -Table.Profile(# “SalesDetail”) 3. Create a visual on a report page using fields from the new table. |
| You create the following step by using Power Query Editor. - Table.ReplaceValue(SalesLT_Address,"1318","1319",Replacer.ReplaceText,{"AddressLine1"}) A row has a value of 21318 Lasalle Street in the AddressLine1 column. What will the value be when the step is applied? • A. 1318 • B. 1319 • C. 21318 Lasalle Street • D. 21319 Lasalle Street | D. 21319 Lasalle Street (1318 wird zu 1319 in Spalte „AddressLine1“) |
| You have a Microsoft Power BI report. The size of PBIX file is 550 MB. The report is accessed by using an App workspace in shared capacity of powerbi.com. The report uses an imported dataset that contains one fact table. The fact table contains 12 million rows. The dataset is scheduled to refresh twice a day at 08:00 and 17:00. The report is a single page that contains 15 AppSource visuals and 10 default visuals. Users say that the report is slow to load the visuals when they access and interact with the report. You need to recommend a solution to improve the performance of the report. What should you recommend? • A. Increase the number of times that the dataset is refreshed. • B. Split the visuals onto multiple pages. • C. Change the imported dataset to DirectQuery. • D. Implement row-level security (RLS). | B. Split the visuals onto multiple pages. |
| You create a dashboard by using the Microsoft Power BI Service. The dashboard contains a card visual that shows total sales from the current year. You grant users access to the dashboard by using the Viewer role on the workspace. A user wants to receive daily notifications of the number shown on the card visual. You need to automate the notifications. What should you do? • A. Create a data alert. • B. Share the dashboard to the user. • C. Create a subscription. • D. Tag the user in a comment. | C. Create a subscription. |
| You are modeling data by using Microsoft Power BI. Part of the data model is a large Microsoft SQL Server table named Order that has more than 100 million records. During the development process, you need to import a sample of the data from the Order table. Solution: From Power Query Editor, you import the table and then add a filter step to the query. Does this meet the goal? • A. Yes • B. No | A. Yes Query Folding: in SQL werden alle Schritte gleichzeitig übergeben, auch der Filter |
| You are modeling data by using Microsoft Power BI. Part of the data model is a large Microsoft SQL Server table named Order that has more than 100 million records. During the development process, you need to import a sample of the data from the Order table. Solution: You add a WHERE clause to the SQL statement. Does this meet the goal? • A. Yes • B. No | A. Yes |
| You are modeling data by using Microsoft Power BI. Part of the data model is a large Microsoft SQL Server table named Order that has more than 100 million records. During the development process, you need to import a sample of the data from the Order table. You create a parameter named DataSourceExcel that holds the file name and location of a Microsoft Excel data source. You need to update the query to reference the parameter instead of multiple hard-coded copies of the location within each query definition. Solution: In the Power Query M code, you replace references to the Excel file with DataSourceExcel. Does this meet the goal? • A. Yes • B. No | A. Yes |
| You are modeling data by using Microsoft Power BI. Part of the data model is a large Microsoft SQL Server table named Order that has more than 100 million records. During the development process, you need to import a sample of the data from the Order table. You create a parameter named DataSourceExcel that holds the file name and location of a Microsoft Excel data source. You need to update the query to reference the parameter instead of multiple hard-coded copies of the location within each query definition. Solution: You modify the source step of the queries to use DataSourceExcel as the file path. Does this meet the goal? • A. Yes • B. No | A. Yes |
| You are modeling data by using Microsoft Power BI. Part of the data model is a large Microsoft SQL Server table named Order that has more than 100 million records. During the development process, you need to import a sample of the data from the Order table. You create a parameter named DataSourceExcel that holds the file name and location of a Microsoft Excel data source. You need to update the query to reference the parameter instead of multiple hard-coded copies of the location within each query definition. Solution: You create a new query that references DataSourceExcel. Does this meet the goal? • A. Yes • B. No | B. No |
| You are modeling data by using Microsoft Power BI. Part of the data model is a large Microsoft SQL Server table named Order that has more than 100 million records. During the development process, you need to import a sample of the data from the Order table. Solution: You add a report-level filter that filters based on the order date. Does this meet the goal? • A. Yes • B. No | B. No |
| You are modeling data by using Microsoft Power BI. Part of the data model is a large Microsoft SQL Server table named Order that has more than 100 million records. During the development process, you need to import a sample of the data from the Order table. Solution: You write a DAX expression that uses the FILTER function. Does this meet the goal? • A. Yes • B. No | B. No |
| You have a Power BI dashboard that monitors the quality of manufacturing processes. The dashboard contains the following elements: - A line chart that shows the number of defective products manufactured by day. - A KPI visual that shows the current daily percentage of defective products manufactured. You need to be notified when the daily percentage of defective products manufactured exceeds 3%. What should you create? • A. a Q&A visual • B. a subscription • C. a smart narrative visual • D. an alert | D. an alert |
|
Image:
72 (binary/octet-stream)
|
Image:
73 (binary/octet-stream)
|
|
✑ Visualizations that include all measures in the data over time
✑ Year-over-year calculations for all the measures
Which four actions should you perform in sequence to prepare data?
1. Rename the Attribute column as Year
2. Rename the Measure column as Year
3. Use the first row as header
4. Use headers as the first row
5. Unpivot all the columns other than Measure
6. Transpose the table
7. Change the data type of the Year column to Date
Image:
6 (binary/octet-stream)
|
1. Use the first row as headers 2. Unpivot all the columns other than Measure 3. Change the column attribute to year 4. Change the datatype of year to date |
| You are reviewing a query that produces 10,000 rows in the Power Query Editor. You need to identify whether a column contains only unique values. Which two Data Preview options can you use? Each correct answer presents a complete solution. NOTE: Each correct selection is worth one point. • A. Column profile • B. Column distribution • C. Show whitespace • D. Column quality • E. Monospaced | • A. Column profile • B. Column distribution |
|
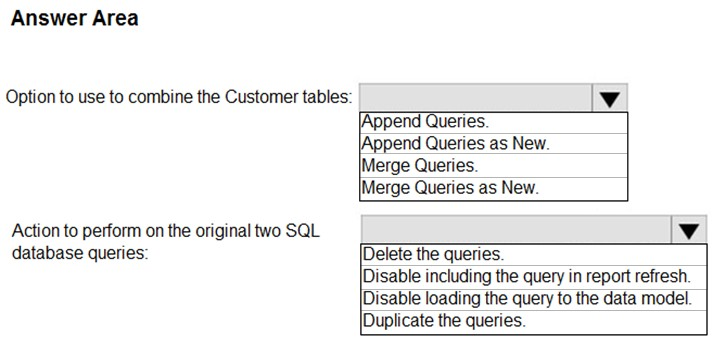
You have two Azure SQL databases that contain the same tables and columns.
For each database, you create a query that retrieves data from a table named Customer.
You need to determine the Customer tables into a single table. The solution must minimize the size of the data model and support scheduled refresh in powerbi.com.
What should you do?
Image:
9 (binary/octet-stream)
|
Box 1: Append Queries as New. Box 2: Disable loading the query to the data model |
|
Image:
Xx (binary/octet-stream)
|
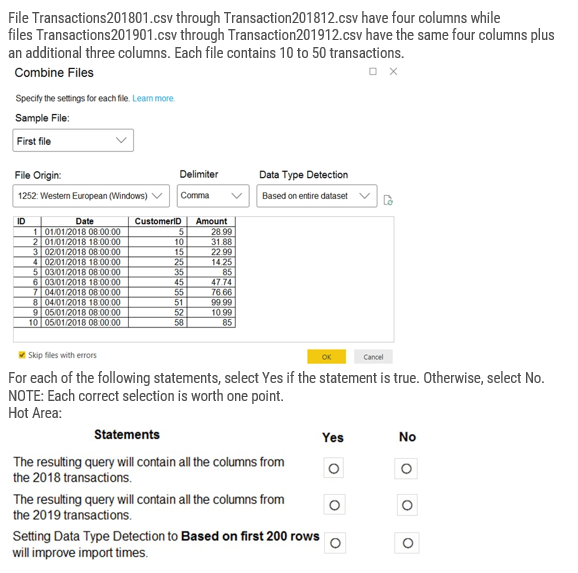
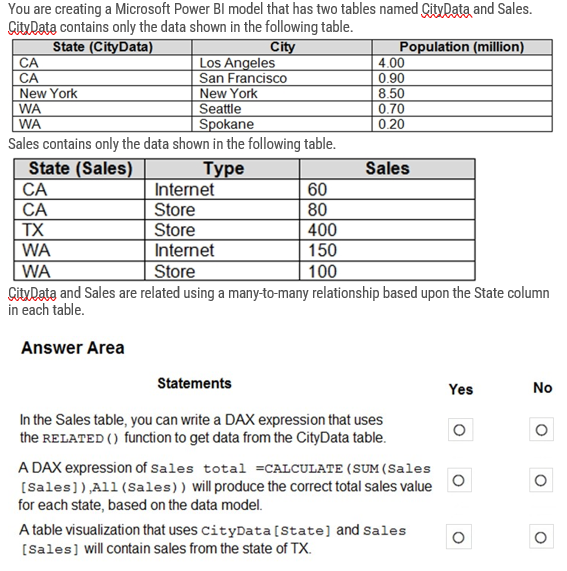
Yes No No |
|
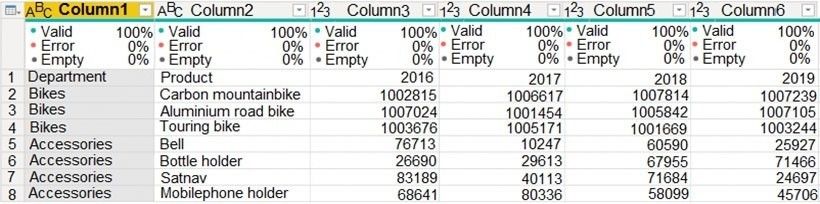
You plan to create several visuals from the data, including a visual that shows revenue split by year and product.
You need to transform the data to ensure that you can build the visuals. The solution must ensure that the columns are named appropriately for the data that they contain.
Which three actions should you perform in sequence?
1. Rename the Attribute column to Revenue and the Value column to Year
2. Select Department and Product and Unpivot Columns.
3. Select Use First Row as Headers
4. Rename the Attribute column to Year and the Value column to Revenue
5. Select Use Header as First Row
6. Select Deparment and Product and Unpivot Other Columns
Image:
10 (binary/octet-stream)
|
Step 1: Select First Row as Headers. Step 2: Select Department and Product and Unpivot Other Columns Step 3: Rename the Attribute column to Year and the Value column to Revenue. |
|
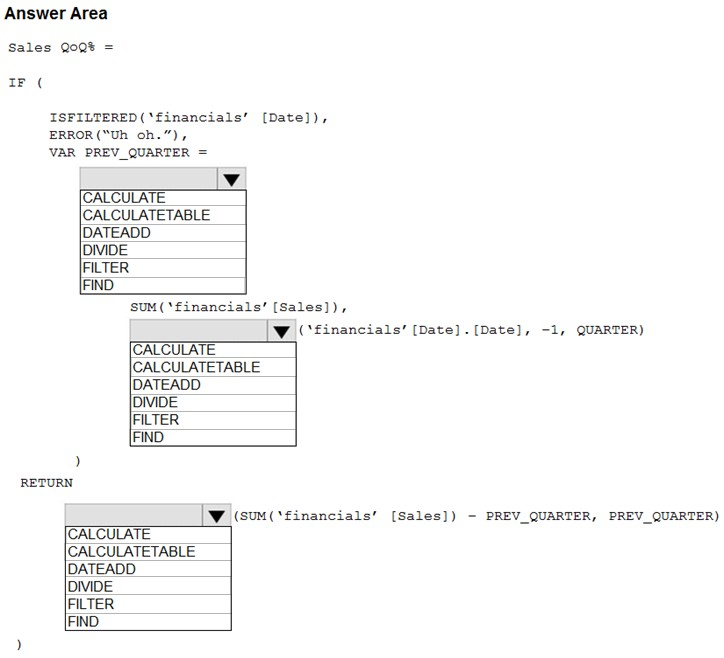
You have a table named financials that contains a column named Date and a column named Sales.
You need to create a measure that calculates the relative change in sales as compared to the previous quarter.
How should you complete the measure?
Image:
11 (binary/octet-stream)
|
Box 1: CALCULATE - Box 2: DATEADD - Box 3: DIVIDE |
| Your company has training videos that are published to YouTube. You need to surface the videos directly in a Microsoft Power BI dashboard. Which type of tile should you add? • A. video • B. custom streaming data • C. text box • D. web content | A. video |
|
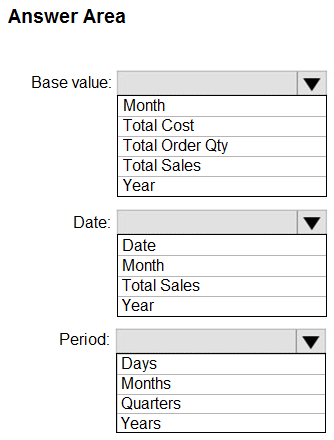
You need to create a monthly rolling average measure for Sales over time.
How should you configure the quick measure calculation? To answer, select the appropriate options in the answer area.
Image:
12 (binary/octet-stream)
|
1. Base Value: Total Sales 2. Date: Date 3. Perios: Months |
| You have four sales regions. Each region has multiple sales managers. You implement row-level security (RLS) in a data model. You assign the relevant mail-enabled security group to each role. You have sales reports that enable analysis by region. The sales managers can view the sales records of their region. The sales managers are prevented from viewing records from other regions. A sales manager changes to a different region. You need to ensure that the sales manager can see the correct sales data. What should you do? • A. Change the Microsoft Power BI license type of the sales manager. • B. From Microsoft Power BI Desktop, edit the Row-Level Security setting for the reports. • C. Request that the sales manager be added to the correct Azure Active Directory group. • D. Manage the permissions of the underlying dataset. | C. Request that the sales manager be added to the correct Azure Active Directory group. |
|
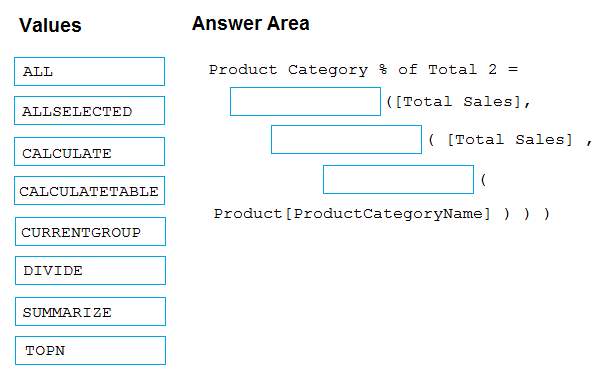
You have a Microsoft Power BI data model that contains three tables named Sales, Product, and Date.
The Sales table has an existing measure named [Total Sales] that sums the total sales from the Sales table.
You need to write a calculation that returns the percentage of total sales that a selected ProductCategoryName value represents. The calculation must respect any slicers on ProductCategoryName and must show the percentage of visible total sales. For example, if there are four ProductCategoryName values, and a user filters one out, a table showing ProductCategoryName and the calculation must sum up to 100 percent.
Image:
13 (binary/octet-stream)
|
DIVIDE CALCULATE ALLSELECTED |
| You have sales data in a star schema that contains four tables named Sales, Customer, Date, and Product. The Sales table contains purchase and ship dates. Most often, you will use the purchase date to analyze the data, but you will analyze the data by both dates independently and together. You need to design an imported dataset to support the analysis. The solution must minimize the model size and the number of queries against the data source. Which data modeling design should you use? • A. Use the Auto Date/Time functionality in Microsoft Power BI and do NOT import the Date table. • B. Duplicate the Date query in Power Query and create active relationships between Sales and both Date tables in the modeling view. • C. On the Date table, use a reference query in Power Query and create active relationships between Sales and both Date tables in the modeling view. • D. Import the Date table twice in Power Query and create active relationships between Sales and both Date tables in the modeling view. | D. Import the Date table twice in Power Query and create active relationships between Sales and both Date tables in the modeling view. |
|
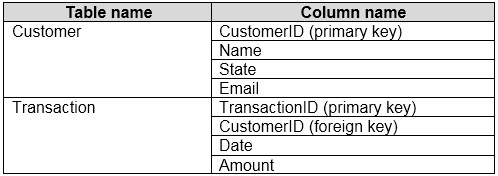
You build a report to analyze customer transactions from a database that contains the tables shown in the following table.
You import the tables.
Which relationship should you use to link the tables?
• A. many-to-many between Customer and Transaction
• B. one-to-many from Transaction to Customer
• C. one-to-many from Customer to Transaction
• D. one-to-one between Customer and Transaction
Image:
14 (binary/octet-stream)
|
C. one-to-many from Customer to Transaction |
|
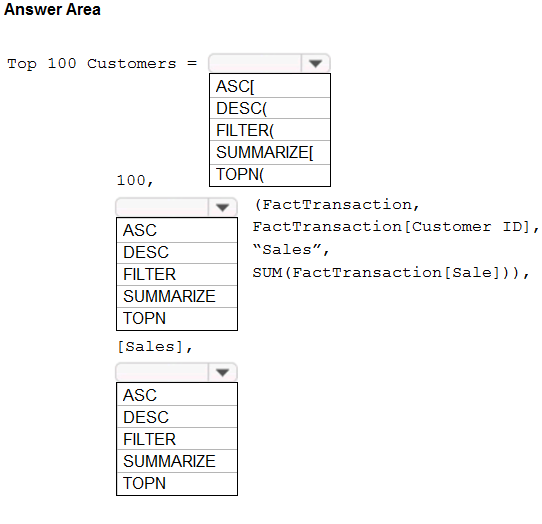
You need to create a calculated table to return the 100 highest spending customers.
How should you complete the DAX expression?
Image:
15 (binary/octet-stream)
|
1. TOPN 2. SUMMARIZE 3. DESC |
| You have a Microsoft Power BI data model that contains three tables named Orders, Date, and City. There is a one-to-many relationship between Date and Orders and between City and Orders. The model contains two row-level security (RLS) roles named Role1 and Role2. Role1 contains the following filter. City[State Province] = "Kentucky" Role2 contains the following filter. Date[Calendar Year] = 2020 - If a user is a member of both Role1 and Role2, what data will they see in a report that uses the model? • A. The user will see data for which the State Province value is Kentucky and the Calendar Year is 2020. • B. The user will see data for which the State Province value is Kentucky or the Calendar Year is 2020. • C. The user will see only data for which the State Province value is Kentucky. • D. The user will receive an error and will not be able to see the data in the report. | B. The user will see data for which the State Province value is Kentucky or the Calendar Year is 2020. |
|
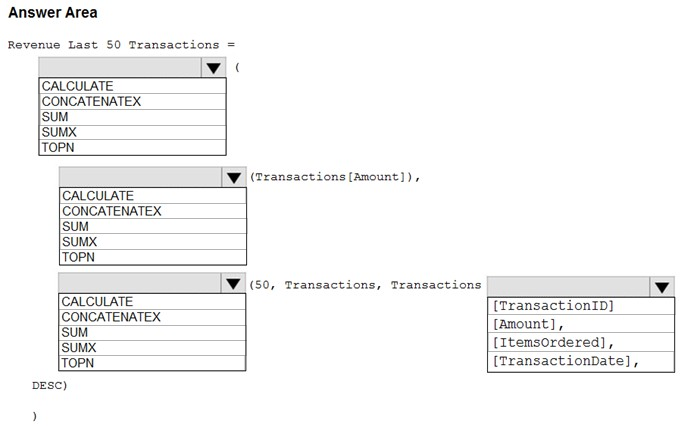
You build a report for the affiliate managers at the company to assist them in understanding affiliate performance.
The managers request a visual showing the total sales value of the latest 50 transactions for each affiliate. You have a data model that contains the following tables.
The Affiliate table has a one-to-many relationship to the Transactions table based on the AffiliateID column.
You need to develop a measure to support the visual.
How should you complete the DAX expression?
Image:
16 (binary/octet-stream)
|
1. CALCULATE 2. SUM 3. TOPN 4. [TranactionDate] |
| You are configuring a Microsoft Power BI data model to enable users to ask natural language questions by using Q&A. You have a table named Customer that has the following measure. Customer Count = DISTINCTCOUNT(Customer[CustomerID]) Users frequently refer to customers as subscribers. You need to ensure that the users can get a useful result for "subscriber count" by using Q&A. The solution must minimize the size of the model. What should you do? • A. Set Summarize By to None for the CustomerID column. • B. Add a synonym of "subscriber" to the Customer table. • C. Add a synonym of "subscriberID" to the CustomerID column. • D. Add a description of "subscriber count" to the Customer Count measure. | B. Add a synonym of "subscriber" to the Customer table. |
|
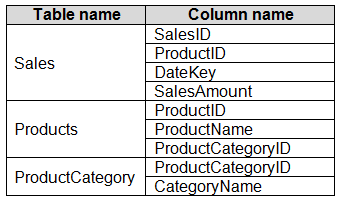
The Products table is related to the ProductCategory table through the ProductCategoryID column.
You need to ensure that you can analyze sales by product category.
How should you configure the relationships from Products to ProductCategory
Cardinality: One-to-many
One -to-one
Many-to-many
Cross-filter direction: Single
Both
Image:
17 (binary/octet-stream)
|
1. One-to-many 2. Single |
|
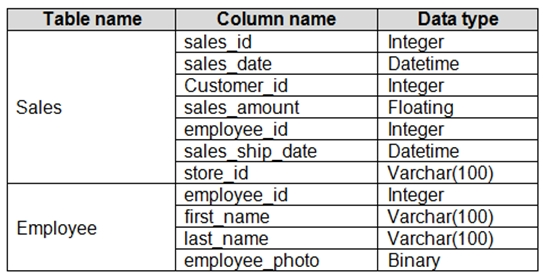
There is a relationship between the tables.
There are no reporting requirements on employee_id and employee_photo.
You need to optimize the data model.
Emloyee_id:
Change Type | Delete | Hide | Sort
Employee_photo:
Change Type | Delete | Hide | Sort
Image:
18 (binary/octet-stream)
|
Emloyee_id: Hide Employee_photo: Delete |
|
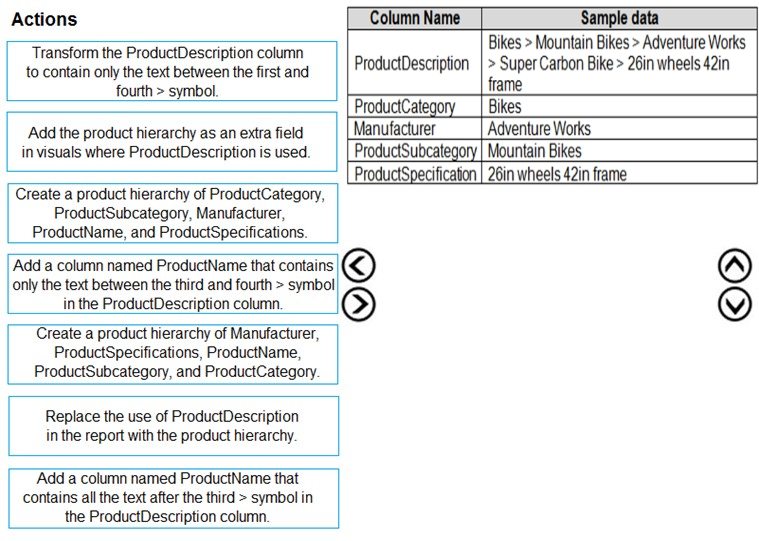
Warehouse managers report that it is difficult to use the report because the report uses only the product name in tables and visuals. The product name is contained within the ProductDescription column and is always the fourth value.
You need to modify the report to support the warehouse managers requirement to explore inventory levels at different levels of the product hierarchy. The solution must minimize the model size.
Which three actions should you perform in sequence?
Image:
20 (binary/octet-stream)
|
1. Add column named ProductName that contains only the text between the third and fourth > symbol in the ProductDescription column. 2. Create a product hierarchy of ProductCategory, ProductSubcategory, Manufacturer, ProductName, and ProductSpecifications 3. Replace the use of ProductDescription in the report with the product hierarchy. |
|
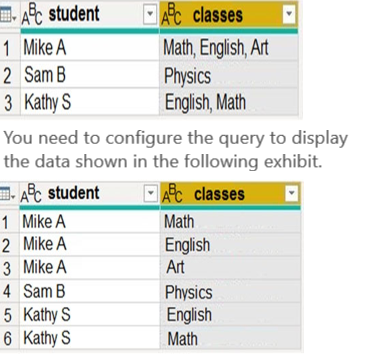
Which step should you use in the query?
• A. = Table.SplitColumn(Source, "classes", Splitter.SplitTextByDelimiter(",", QuoteStyle.None), {"classes.1"})
• B. = Table.Unpivot(Source, {"classes"}, "Attribute", "Value")
• C. = Table.SplitColumn(Source, "classes", Splitter.SplitTextByPositions({10}), {"classes.1"})
• D. = Table.ExpandListColumn(Table.TransformColumns(Source, {{"classes", Splitter.SplitTextByDelimiter(",", QuoteStyle.None), let itemType = (type nullable text) meta [Serialized.Text = true] in type {itemType}}}), "classes")
Image:
21 (binary/octet-stream)
|
D. = Table.ExpandListColumn(Table.TransformColumns(Source, {{"classes", Splitter.SplitTextByDelimiter(",", QuoteStyle.None), let itemType = (type nullable text) meta [Serialized.Text = true] in type {itemType}}}), "classes") |
| You have files sales regions. Each region is assigned a single salesperson. You have an imported dataset that has a dynamic row-level security (RLS) role named Sales. The Sales role filters sales transaction data by salesperson. Salespeople must see only the data from their region. You publish the dataset to powerbi.com, set RLS role membership, and distribute the dataset and related reports to the salespeople. A salesperson reports that she believes she should see more data. You need to verify what data the salesperson currently sees. What should you do? • A. Use the Test as role option to view data as the salesperson's user account. • B. Instruct the salesperson to open the report in Microsoft Power BI Desktop. • C. Filter the data in the reports to match the intended logic in the filter on the sales transaction table. • D. Use the Test as role option to view data as the Sales role. | A. Use the Test as role option to view data as the salesperson's user account. |
|
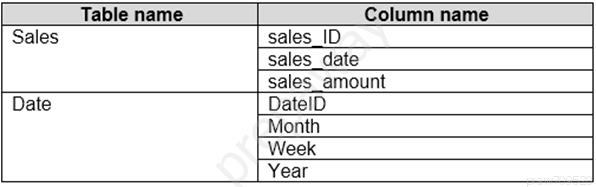
The Date table is marked as a date table. DateID is the date data type.
You need to create an annual sales growth percentage measure.
Which DAX expression should you use?
• A. SUM(sales[sales_amount]) - CALCULATE(SUM(sales[sales_amount]), SAMEPERIODLASTYEAR('Date'[DateID])
• B. (SUM('Sales'[sales_amount]) - CALCULATE(SUM('Sales'[sales_amount]), SAMEPERIODLASTYEAR('Date'[DateID])))
/ CALCULATE(SUM('Sales'[sales_amount]), SAMEPERIODLASTYEAR('Date'[DateID]))
• C. CALCULATE(SUM(sales[sales_amount]), DATESYTD('Date'[DateID]))
• D. CALCULATE(SUM(sales[sales_amount]), SAMEPERIODLASTYEAR('Date'[DateID]))
Image:
22 (binary/octet-stream)
|
B. (SUM('Sales'[sales_amount]) - CALCULATE(SUM('Sales'[sales_amount]), SAMEPERIODLASTYEAR('Date'[DateID]))) / CALCULATE(SUM('Sales'[sales_amount]), SAMEPERIODLASTYEAR('Date'[DateID])) |
| In Power BI Desktop, you are building a sales report that contains two tables. Both tables have row-level security (RLS) configured. You need to create a relationship between the tables. The solution must ensure that bidirectional cross-filtering honors the RLS settings. What should you do? • A. Create an active relationship between the tables and select Assume referential integrity. • B. Create an inactive relationship between the tables and select Assume referential integrity. • C. Create an inactive relationship between the tables and select Apply security filter in both directions. • D. Create an active relationship between the tables and select Apply security filter in both directions. | D. Create an active relationship between the tables and select Apply security filter in both directions. |
|
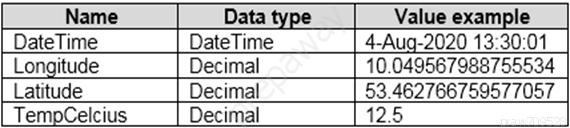
You have a Power BI dataset that contains a table named Temperature Readings. Temperature Readings contains the columns shown in the following table.
The table has 12 million rows. All the columns are needed for analysis.
You need to optimize the dataset to decrease the model size. The solution must not affect the precision of the data.
What should you do?
• A. Split the DateTime column into separate date and time columns.
• B. Change the data type of the DateTime column to Date.
• C. Change the data type of the Latitude column to Fixed Decimal.
• D. Disable the Power Query load.
Image:
23 (binary/octet-stream)
|
A. Split the DateTime column into separate date and time columns. |
| You use an R visual to produce a map of 500,000 customers. You include the values of CustomerID, Latitude, and Longitude in the fields sent to the visual. Each customer ID is unique. In powerbi.com, when users load the visual, they only see some of the customers. What is the cause of the issue? • A. The visual was built by using a different version of R. • B. The data comes from a Microsoft SQL Server source. • C. The data is deduplicated. • D. Too many records were sent to the visual. | D. Too many records were sent to the visual. (R visual for plotting is limited to 150,000 rows) |
| You have a line chart that shows the number of employees in a department over time. You need to see the total salary costs of the employees when you hover over a data point. What is one possible way to achieve this goal? Each correct answer presents a complete solution. • A. Add a salary to the tooltips. • B. Add a salary to the visual filters. • C. Add salary to the drillthrough fields. | A. Add a salary to the tooltips. |
| You have a report that contains a bar chart and a column chart. The bar chart shows customer count by customer segment. The column chart shows sales by month. You need to ensure that when a segment is selected in the bar chart, you see which portion of the total sales for the month belongs to the customer segment. How should the visual interactions be set on the column chart when the bar chart is selected? • A. no impact • B. highlight • C. filter | B. highlight |
|
• A. Edit the details of each tile.
• B. Change the report theme.
• C. Change the dashboard theme.
• D. Create a custom CSS file.
Image:
24 (binary/octet-stream)
|
C. Change the dashboard theme. |
|
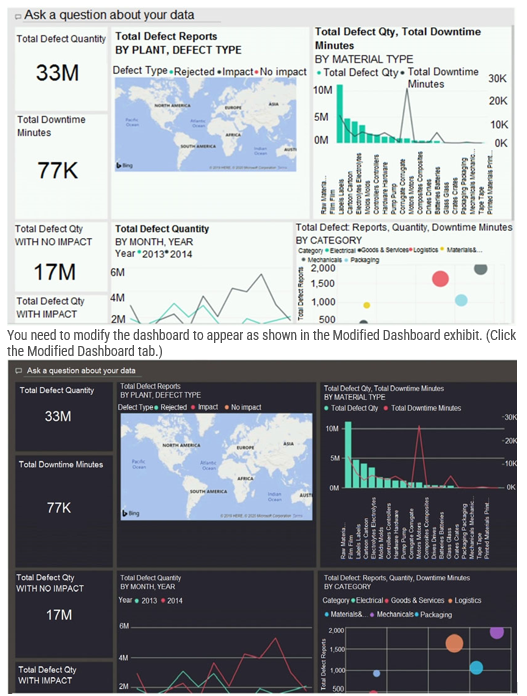
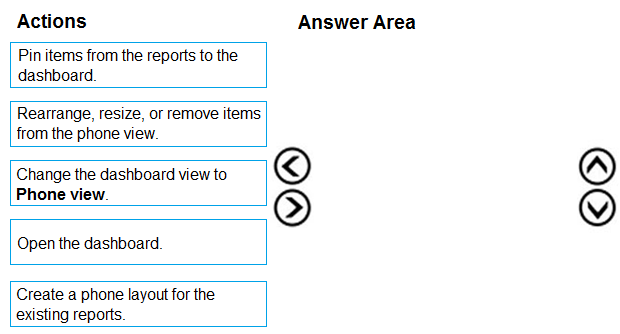
You are using existing reports to build a dashboard that will be viewed frequently in portrait mode on mobile phones.
You need to build the dashboard.
Which four actions should you perform in sequence?
Image:
25 (binary/octet-stream)
|
1. Pin items from the report to the dashboard. 2. Open the dashboard. 3. Change the dashboard view to Phone view. 4. Rearrange, resize, or remove items from the phone view. |
| You build a report to help the sales team understand its performance and the drivers of sales. The team needs to have a single visualization to identify which factors affect success. Which type of visualization should you use? • A. Line and clustered column chart • B. Key influencers • C. Q&A • D. Funnel chart | B. Key influencers |
|
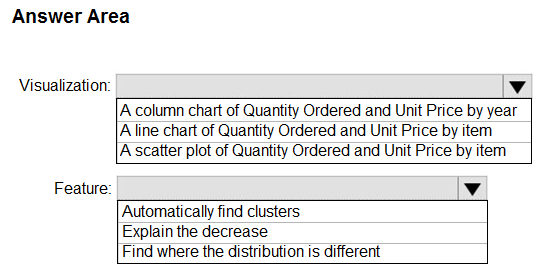
You have a dataset named Pens that contains the following columns:
✑ Unit Price
✑ Quantity Ordered
You need to create a visualization that shows the relationship between Unit Price and Quantity Ordered. The solution must highlight orders that have a similar unit price and ordered quantity.
Which type of visualization and which feature should you use? To answer, select the appropriate options in the answer area.
Image:
26 (binary/octet-stream)
|
Visualization: A scatter plot of Quantify Ordered and Unit Price by item Feature: Automatically find clusters |
|
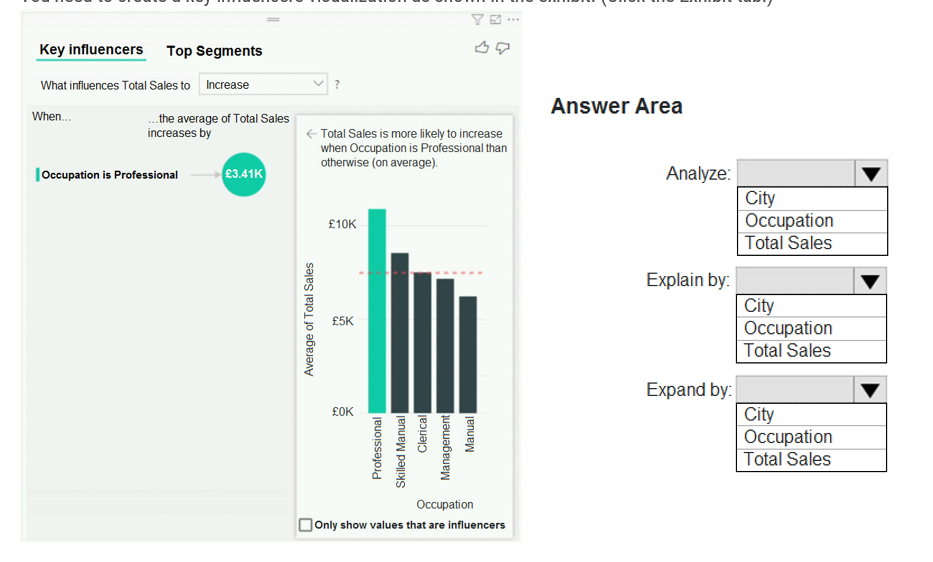
You have a table that contains the following three columns:
✑ City
✑ Total Sales
✑ Occupation
You need to create a key influencers visualization as shown in the exhibit.
How should you configure the visualization? To answer, select the appropriate options in the answer area.
Image:
27 (binary/octet-stream)
|
Analyze: Total Sales Explain by: Occupation Expand by: City |
|
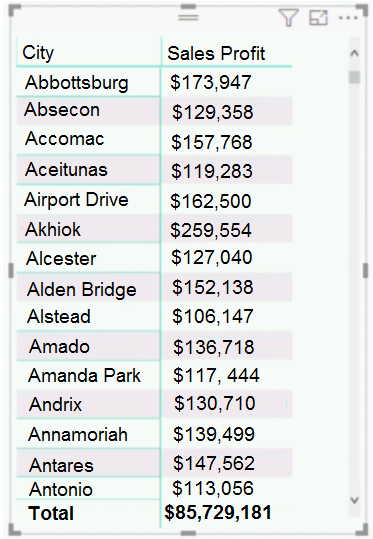
You need to ensure that the visual shows only the 10 cities that have the highest sales profit.
What should you do?
• A. Add a Top N filter to the visual.
• B. Configure the Sales Profit measure to use the RANKX function.
• C. Add a calculated column to the table that uses the TOPN function. In the visual, replace Sales Profit with the calculated column.
• D. Add a calculated column to the table that returns the city name if the city is in the top 10, otherwise the calculated column will return "Not in Top 10". In the visual, replace Sales Profit with the calculated column.
Image:
28 (binary/octet-stream)
|
A. Add a Top N filter to the visual. |
| You have a clustered bar chart that contains a measure named Salary as the value and a field named Employee as the axis. Salary is present in the data as numerical amount representing US dollars. You need to create a reference line to show which employees are above the median salary. Solution: You create an average line by using the Salary measure. Does this meet the goal? • A. Yes • B. No | B. No |
| You have a clustered bar chart that contains a measure named Salary as the value and a field named Employee as the axis. Salary is present in the data as numerical amount representing US dollars. You need to create a reference line to show which employees are above the median salary. Solution: You create a percentile line by using the Salary measure and set the percentile to 50%. Does this meet the goal? • A. Yes • B. No | A. Yes |
| You have a Microsoft SharePoint Online site that contain several document libraries. One of the document libraries contains manufacturing reports saved as Microsoft Excel files. All the manufacturing reports have the same data structure. You need to use Power BI Desktop to load only the manufacturing reports to a table for analysis. What should you do? • A. Get data from a SharePoint folder, enter the site URL, and then select Combine & Load. • B. Get data from a SharePoint list and enter the site URL. Select Combine & Transform, then filter by the folder path to the manufacturing reports library. • C. Get data from a SharePoint folder and enter the site URL. Select Combine & Transform, then filter by the folder path to the manufacturing reports library. • D. Get data from a SharePoint list, enter the site URL, and then select Combine & Load. | C. Get data from a SharePoint folder and enter the site URL. Select Combine & Transform, then filter by the folder path to the manufacturing reports library. |
|
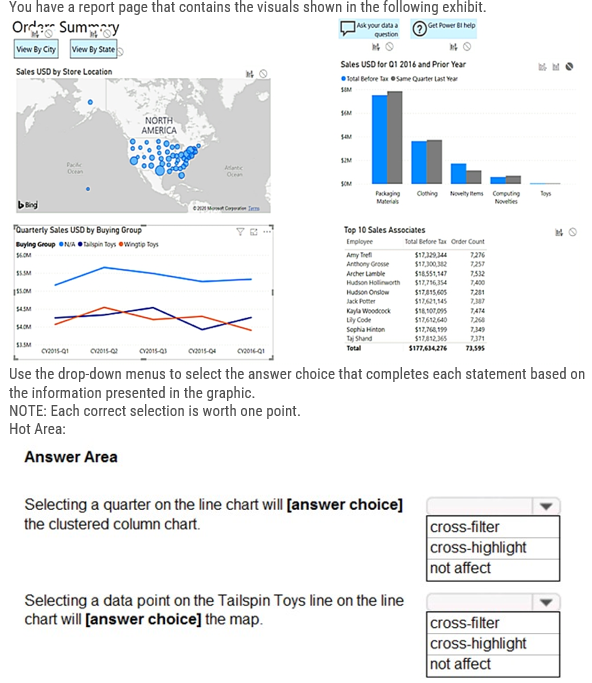
Image:
29 (binary/octet-stream)
|
1. Not affected 2. cross-filter |
| You have a report that contains four pages. Each page contains slicers for the same four fields. Users report that when they select values in a slicer on one page, the selections are not persisted on other pages. You need to recommend a solution to ensure that users can select a value once to filter the results on all the pages. What are two possible recommendations to achieve this goal? Each correct answer presents a complete solution. NOTE: Each correct selection is worth one point. • A. Replace the slicers with report-level filters. • B. Sync the slicers across the pages. • C. Create a bookmark for each slicer value. • D. Replace the slicers with page-level filters. • E. Replace the slicers with visual-level filters. | • A. Replace the slicers with report-level filters. • B. Sync the slicers across the pages. |
|
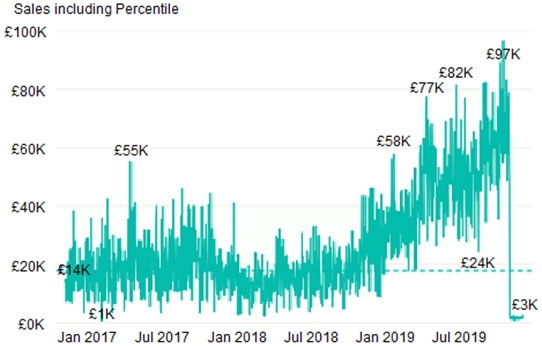
How should you create the dashed horizontal line denoting the 40th percentile of daily sales for the period shown?
• A. Add a measure to the visual that uses the following DAX expression. Measure1 = PERCENTILEX.INC (Sales,Sales[Total Sales],0.40)
• B. Add a new percentile line that uses Total Sales as the measure and 40% as the percentile.
• C. Create a horizontal line that has a fixed value of 24,000.
• D. Add a measure to the visual that uses the following DAX expression. Measure1 = PERCENTILEX.EXC (Sales,Sales[Total Sales],0.40)
Image:
30 (binary/octet-stream)
|
B. Add a new percentile line that uses Total Sales as the measure and 40% as the percentile. |
| You have a table that contains sales data and approximately 1,000 rows. You need to identify outliers in the table. Which type of visualization should you use? • A. donut chart • B. pie chart • C. area chart • D. scatter plot | D. scatter plot |
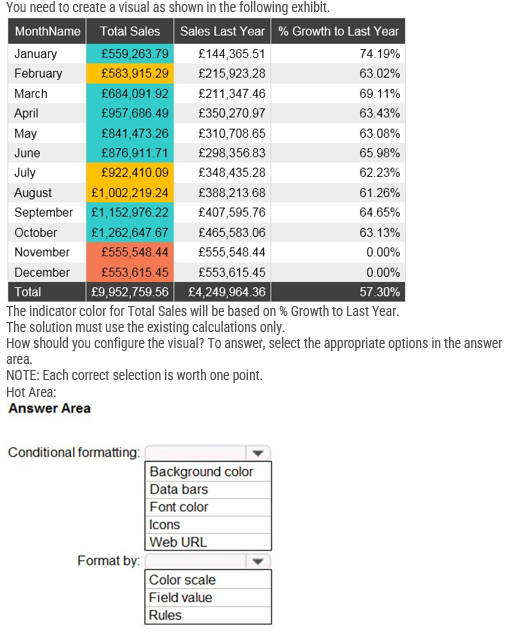
|
Image:
31 (binary/octet-stream)
|
Conditional formatting: Background color Format by: Rules |
|
Image:
Xx2 (binary/octet-stream)
|
No Yes No |
| You have a clustered bar chart that contains a measure named Salary as the value and a field named Employee as the axis. Salary is present in the data as numerical amount representing US dollars. You need to create a reference line to show which employees are above the median salary. Solution: You create a constant line and set the value to .5. Does this meet the goal? • A. Yes • B. No | B. No |
| You need to create a visualization that compares revenue and cost over time. Which type of visualization should you use? • A. stacked area chart • B. donut chart • C. line chart • D. waterfall chart | C. line chart |
| You have a collection of reports for the HR department of your company. You need to create a visualization for the HR department that shows a historic employee counts and predicts trends during the next six months. Which type of visualization should you use? • A. key influencers • B. ribbon chart • C. line chart • D. scatter chart | C. line chart |
| You have a clustered bar chart that contains a measure named Salary as the value and a field named Employee as the axis. Salary is present in the data as numerical amount representing US dollars. You need to create a reference line to show which employees are above the median salary. Solution: You create a median line by using the Salary measure. Does this meet the goal? • A. Yes • B. No | A. Yes |
| You are developing a sales report that will have multiple pages. Each page will answer a different business question. You plan to have a menu page that will show all the business questions. You need to ensure that users can click each business question and be directed to the page where the question is answered. The solution must ensure that the menu page will work when deployed to any workspace. What should you include on the menu page? • A. Create a text box for each business question and insert a link. • B. Create a button for each business question and set the action type to Page Navigation. • C. Create a Power Apps visual that contains a drop-down list. The drop-down list will contain the business questions. | B. Create a button for each business question and set the action type to Page Navigation. |
| You are developing a report page. Some users will navigate the report by using a keyboard, and some users will consume the report by using a screen reader. You need to ensure that the users can consume the content on a report page in a logical order. What should you configure in Microsoft Power BI Desktop? • A. the tab order • B. the layer order • C. the bookmark order • D. the X position | A. the tab order |
|
Image:
32 (binary/octet-stream)
|
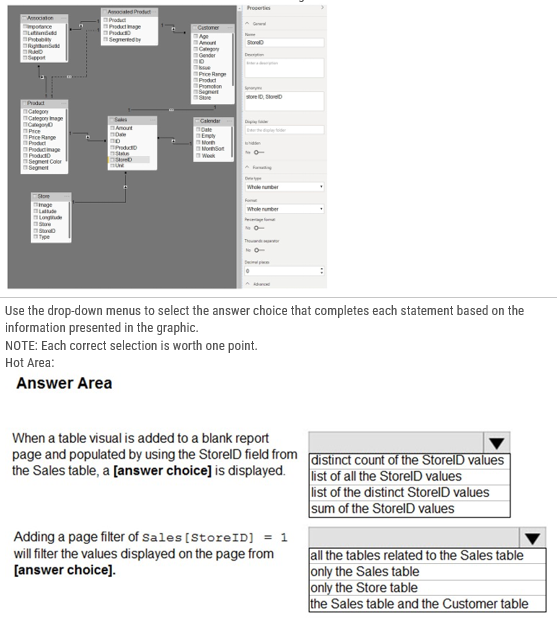
1. list of distinct StoreID values 2. the Sales table and the Customer table |
|
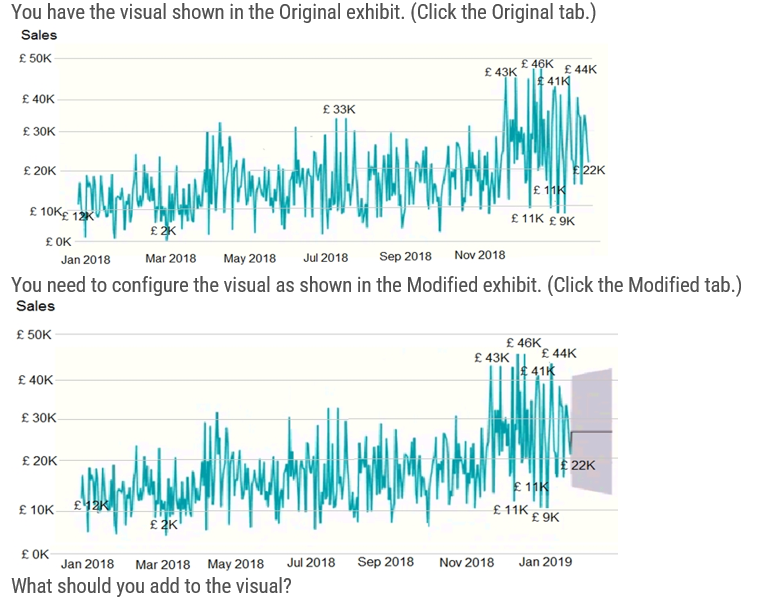
What should you add to the visual?
• A. an Average line
• B. a forecast
• C. a measure
• D. a trendline
Image:
33 (binary/octet-stream)
|
B. a forecast |
| You have a Microsoft Power BI dashboard. You need to ensure that consumers of the dashboard can give you feedback that will be visible to the other consumers of the dashboard. What should you use? • A. Mark as favorite • B. Feedback • C. Comments • D. Subscribe | C. Comments |
| You are creating a visual to show the ranking of product categories by sales revenue. Your company's security policy states that you cannot send data outside of your Microsoft Power BI tenant. Which approach provides the widest variety of visuals while adhering to the security policy? • A. Use default or certified AppSource visuals. • B. Use only default visuals. • C. Use default visuals or visuals uploaded from a .pbiviz file. • D. Use default or any AppSource visuals from the marketplace. | A. Use default or certified AppSource visuals. |
|
What occurred at 12:03:06 PM?
• A. The dashboard tile cache refreshed.
• B. A new transaction was added to the data source.
• C. A user pressed F5.
• D. A user added a comment to a tile.
Image:
34 (binary/octet-stream)
|
A. The dashboard tile cache refreshed. |
| You have a Power BI report. The report contains visualizations that have interactions. You need to identify which visualizations take the longest to complete. What should you use? A. Query Diagnostics in Power BI B. Performance Analyzer in Power BI Desktop C. SQL Server Profiler D. Microsoft Edge DevTools | B. Performance Analyzer in Power BI |
|
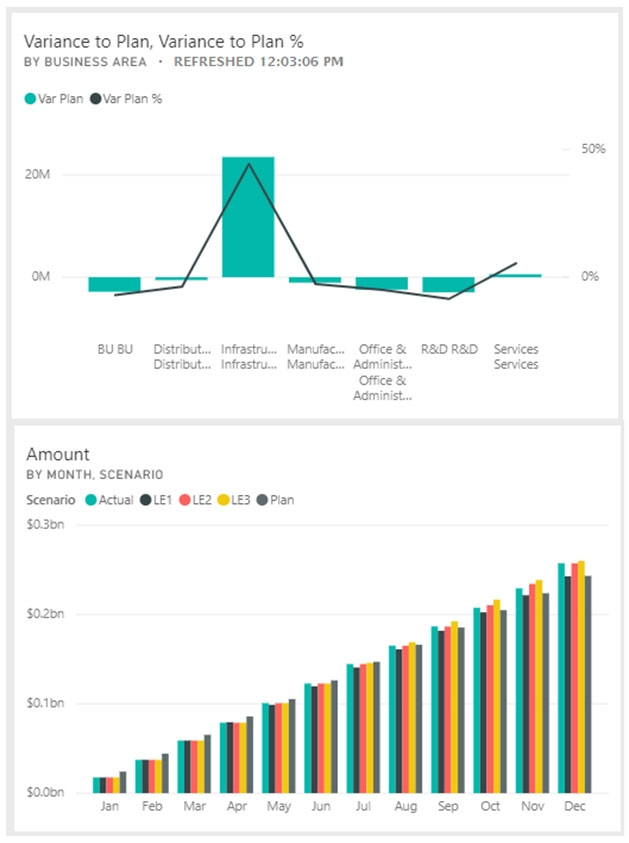
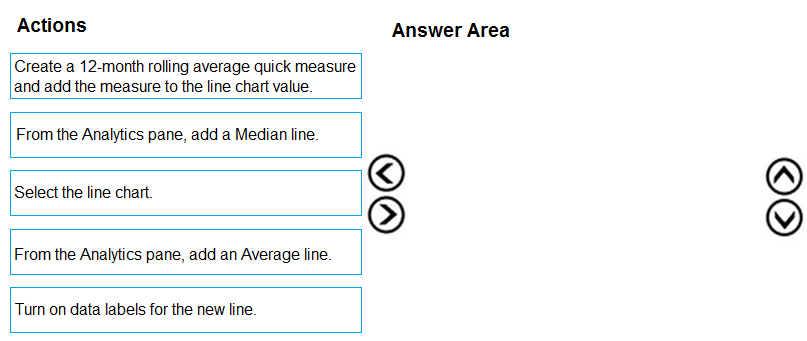
You have the line chart shown in the exhibit. (Click the Exhibit tab.)
You need to modify the chart to meet the following requirements:
✑ Identify months that have order counts above the mean.
✑ Display the mean monthly order count.
Which three actions should you perform in sequence?
Image:
35 (binary/octet-stream)
|
1. Select the line chart 2. Add the average line 3. Turn on Data Label |
|
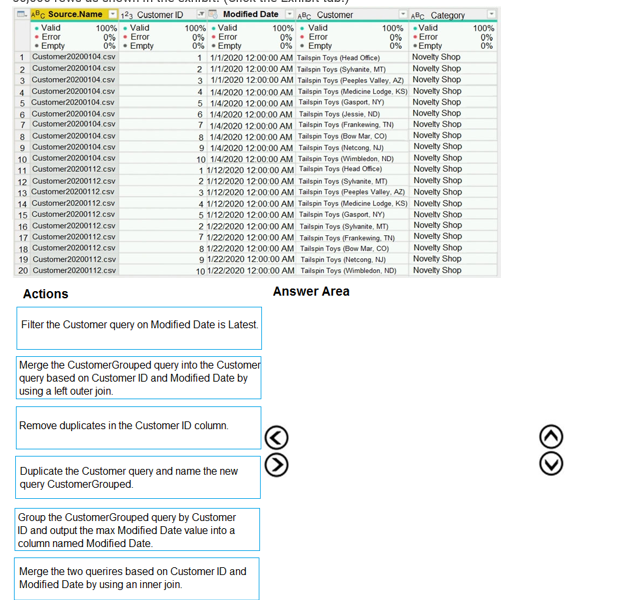
You have a query named Customer that imports CSV files from a data lake. The query contains 50,000 rows as shown in the exhibit. (Click the Exhibit tab.)
Each file contains deltas of any new or modified rows from each load to the data lake. Multiple files can have the same customer ID.
You need to keep only the last modified row for each customer ID.
Which three actions should you perform in sequence?
Image:
36 (binary/octet-stream)
|
1. Duplicate the query 2. Group the query to find the max modified date 3. Merge 2 queries on Customer ID and Modified date by inner join |
|
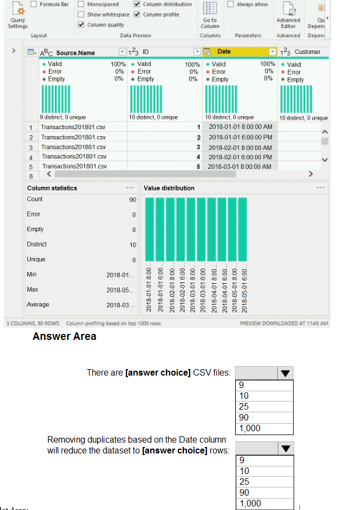
Image:
37 (binary/octet-stream)
|
9 CSV files remove Duplicates -> 10 rows |
| Your company has employees in 10 states. The company recently decided to associate each state to one of the following three regions: East, West, and North. You have a data model that contains employee information by state. The model does NOT include region information. You have a report that shows the employees by state. You need to view the employees by region as quickly as possible. What should you do? • A. Create a new aggregation that summarizes by employee. • B. Create a new group on the state column and set the Group type to List. • C. Create a new group on the state column and set the Group type to Bin. • D. Create a new aggregation that summarizes by state. | B. Create a new group on the state column and set the Group type to List. |
|
Image:
Xx3 (binary/octet-stream)
|
Yes No No |
|
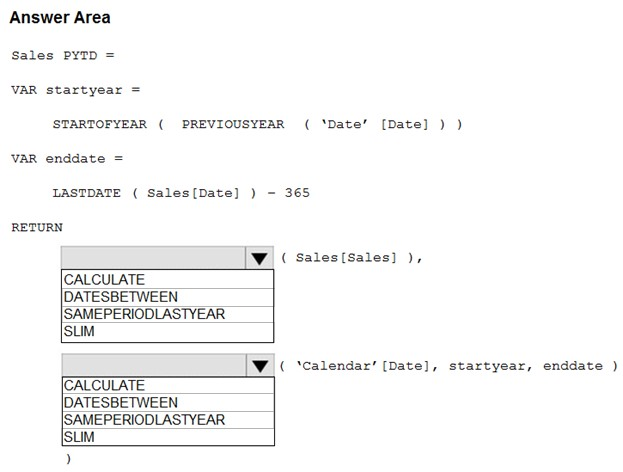
You need to create a measure that returns the year-to-date total sales from the same date of the previous calendar year.
Which DAX functions should you use?
Image:
38 (binary/octet-stream)
|
1. CALCULATE 2. DATESBETWEEN |
| You are configuring a Microsoft Power BI data model to enable users to ask natural language questions by using Q&A. You have a table named Customer that has the following measure. Customer Count = DISTINCTCOUNT(Customer[CustomerID]) Users frequently refer to customers as subscribers. You need to ensure that the users can get a useful result for "subscriber count" by using Q&A. The solution must minimize the size of the model. What should you do? • A. Add a synonym of 'subscriber count' to the Customer Count measure • B. Add a calculated table named Subscriber that is a duplicate of the Customer table. • C. Add a description of 'Subscriber' to the Customer table. • D. Add a description of "subscriber count" to the Customer Count measure. | A. Add a synonym of 'subscriber count' to the Customer Count measure |
|
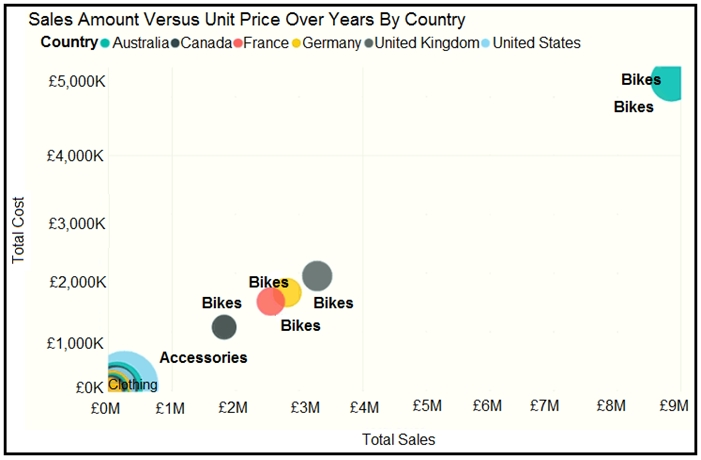
You need to show the relationship between Total Cost and Total Sales over time.
What should you do?
• A. Add a slicer for the year.
• B. Create a DAX measure that calculates year-over-year growth.
• C. Add a play axis.
• D. From the Analytics pane, add an Average line.
Image:
39 (binary/octet-stream)
|
• C. Add a play axis. |
| You have a report that contains three pages. One of the pages contains a KPI visualization. You need to filter all the visualizations in the report except for the KPI visualization. Which two actions should you perform? Each correct answer presents part of the solution. NOTE: Each correct selection is worth one point. • A. Configure a report-level filter. • B. Edit the interactions of the KPI visualization. • C. Configure a page-level filter. • D. Add the same slicer to each page and configure Sync slicers. • E. Edit the interactions of the slicer that is on the same pages as the KPI visualization. | • D. Add the same slicer to each page and configure Sync slicers. • E. Edit the interactions of the slicer that is on the same pages as the KPI visualization. |
|
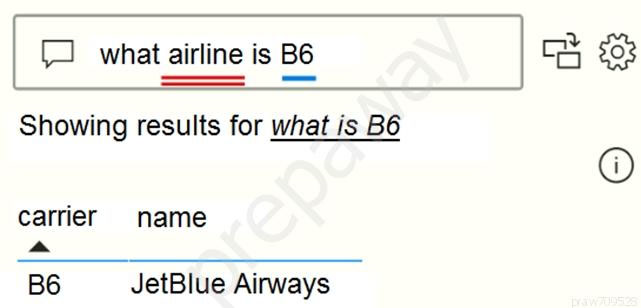
You have a Q&A visual that displays information from a table named Carriers as shown in the following exhibit.
You need to ensure that users can ask questions by using the term airline or carrier. The solution must minimize changes to the data model.
What should you do?
• A. Add a duplicate query named Airline.
• B. Add airline as a synonym of carrier.
• C. Rename the carrier column as airline in the Carriers query.
• D. Rename the query from Carriers to airlines.
You need to ensure that users can ask questions by using the term airline or carrier. The solution must minimize changes to the data model.
What should you do?
Image:
40 (binary/octet-stream)
|
B. Add airline as a synonym of carrier. |
|
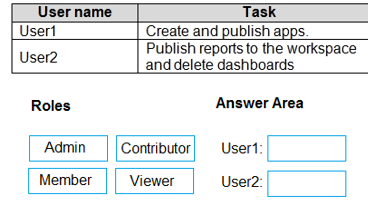
You need to grant the user capabilities shown in the following table.
The solution must use the principle of least privilege.
Which user role should you assign to each user? To answer, drag the appropriate roles to the correct users. Each role may be used once, more than once, or not at all. You may need to drag the split bar between panes or scroll to view content.
Image:
41 (binary/octet-stream)
|
User 1: Member User 2: Contributor |
| You create a dataset sourced from dozens of flat files in Azure Blob storage. The dataset uses incremental refresh. From powerbi.com, you deploy the dataset and several related reports to Microsoft Power BI Premium capacity. You discover that the dataset refresh fails after the refresh runs out of resources. What is a possible cause of the issue? • A. Query folding is not occurring. • B. You selected Only refresh complete periods. • C. The data type of the column used to partition the data changed. • D. A filter is missing on the report. | A. Query folding is not occurring. |
| You have several reports and dashboards in a workspace. You need to grant all organizational users read access to a dashboard and several reports. Solution: You enable included in app for all assets. Does this meet the goal? • A. Yes • B. No | B. No |
| You publish a Microsoft Power BI dataset to powerbi.com. The dataset appends data from an on-premises Oracle database and an Azure SQL database by using one query. You have admin access to the workspace and permission to use an existing On-premises data gateway for which the Oracle data source is already configured. You need to ensure that the data is updated every morning. The solution must minimize configuration effort. Which two actions should you perform when you configure scheduled refresh? Each correct answer presents part of the solution. • A. Configure the dataset to use the existing On-premises data gateway. • B. Deploy an On-premises data gateway in personal mode. • C. Set the refresh frequency to Daily. • D. Configure the dataset to use the personal gateway. | A. Configure the dataset to use the existing On-premises data gateway. C. Set the refresh frequency to Daily. |
| You need to provide a user with the ability to add members to a workspace. The solution must use the principle of least privilege. Which role should you assign to the user? • A. Viewer • B. Contributor • C. Member • D. Admin | C. Member (can add users with lower permission) |
| You have several reports and dashboards in a workspace. You need to grant all organizational users read access to a dashboard and several reports. Solution: You publish an app to the entire organization. Does this meet the goal? • A. Yes • B. No | A. Yes |
| You have multiple dashboards. You need to ensure that when users browse the available dashboards from powerbi.com, they can see which dashboards contain Personally Identifiable Information (PII). The solution must minimize configuration effort and impact on the dashboard design. What should you use? • A. comments • B. tiles • C. Microsoft Information Protection sensitivity labels • D. Active Directory groups | C. Microsoft Information Protection sensitivity labels |
| You have a Power BI tenant. You have reports that use financial datasets and are exported as PDF files. You need to ensure that the reports are encrypted. What should you implement? • A. dataset certifications • B. row-level security (RLS) • C. sensitivity labels • D. Microsoft Intune policies | C. sensitivity labels |
| Your company plans to completely separate development and production assets such as datasets, reports, and dashboards in Microsoft Power BI. You need to recommend an application lifecycle strategy. The solution must minimize access to production assets and prevent end users from viewing the development assets. What should you recommend? • A. Create production reports in a separate workspace that uses a shared dataset from the development workspace. Grant the end users access to the production workspace. • B. Create one workspace for development. From the new workspace, publish an app for production. • C. Create a workspace for development and a workspace for production. From the production workspace, publish an app. • D. In one workspace, create separate copies of the assets and append DEV to the names of the copied assets. Grant the end users access to the workspace. | C. Create a workspace for development and a workspace for production. From the production workspace, publish an app. |
| You have a collection of reports for the HR department of your company. The datasets use row-level security (RLS). The company has multiple sales regions that each has an HR manager. You need to ensure that the HR managers can interact with the data from their region only. The HR managers must be prevented from changing the layout of the reports. How should you provision access to the reports for the HR managers? • A. Publish the reports to a different workspace other than the one hosting the datasets. • B. Publish the reports in an app and grant the HR managers access permission. • C. Add the HR managers as members of the existing workspace that hosts the reports and the datasets. • D. Create a new workspace, copy the datasets and reports, and add the HR managers as members of the workspace. | B. Publish the reports in an app and grant the HR managers access permission. -> like viewer permission, with RLS only restriction for the data set |
| You create a report by using Microsoft Power BI Desktop. The report uses data from a Microsoft SQL Server Analysis Services (SSAS) cube located on your company's internal network. You plan to publish the report to the Power BI Service. What should you implement to ensure that users who consume the report from the Power BI Service have the most up-to-date data from the cube? • A. a subscription • B. a scheduled refresh of the dataset • C. an OData feed • D. an On-premises data gateway | D. an On-premises data gateway |
| You have several reports and dashboards in a workspace. You need to grant all organizational users read access to a dashboard and several reports. Solution: You create an Azure Active Directory group that contains all the users. You share each report and dashboard to the group. Does this meet the goal? • A. Yes • B. No | B. No ("a" Dashboard, so don't share each) |
| You have several reports and dashboards in a workspace. You need to grant all organizational users read access to a dashboard and several reports. Solution: You assign all the users the Viewer role to the workspace. Does this meet the goal? • A. Yes • B. No | B. No |
| You are building a Power BI report to analyze customer segments. You need to identify customer segments dynamically based on the Bounce Rate across dimensions such as source, geography, and demographics. The solution must minimize analysis effort. Which type of visualization should you use? • A. funnel chart • B. key influencers • C. Q&A • D. decomposition tree | D. decomposition tree |
| Case Study: Litware Inc Link: https://justpaste.it/7v59b You need to create a calculated column to display the month based on the reporting requirements. Which DAX expression should you use? • A. FORMAT('Date'[date], "MMM YYYY") • B. FORMAT('Date' [date], "M YY") • C. FORMAT('Date'[date_id], "MMM") & "" & FORMAT('Date'[year], "#") • D. FORMAT('Date' [date_id], "MMM YYYY") | D. FORMAT('Date' [date_id], "MMM YYYY") |
| Case Study: Litware Inc Link: https://justpaste.it/7v59b You need to review the data for which there are concerns before creating the data model. What should you do in Power Query Editor? • A. Transform the sales_amount column to replace negative values with 0. • B. Select Column distribution. • C. Select the sales_amount column and apply a number filter. • D. Select Column profile, and then select the sales_amount column. | D. Select Column profile, and then select the sales_amount column. |
| Case Study: Litware Inc Link: https://justpaste.it/7v59b You need to create the required relationship for the executive’s visual. What should you do before you can create the relationship? • A. Change the data type of Sales[region_id] to Whole Number. • B. Change the data type of Sales[region_id] to Decimal Number. • C. Change the data type of Sales[sales_id] to Text. • D. In the Sales table, add a measure for Sum(sales_amount). | A. Change the data type of Sales[region_id] to Whole Number. |
| Case Study: Litware Inc Link: https://justpaste.it/7v59b What should you create to meet the reporting requirements of the sales department? • A. a measure that uses a formula of SUM(Sales[sales_id]) • B. a calculated column that use a formula of COUNTA(Sales[sales_id]) • C. a measure that uses a formula of COUNTROWS(Sales) • D. a calculated column that uses a formula of SUM(Sales[sales_id]) | C. a measure that uses a formula of COUNTROWS(Sales) |
| Case Study: Litware Inc Link: https://justpaste.it/7v59b You need to provide a solution to provide the sales managers with the required access. What should you include in the solution? • A. Create a security role that has a table filter on the Sales_Manager table where username = UserName(). • B. Create a security role that has a table filter on the Region_Manager table where sales_manager_id = UserPrincipalName(). • C. Create a security role that has a table filter on the Sales_Manager table where name = UserName(). • D. Create a security role that has a table filter on the Sales_Manager table where username = sales_manager_id. | A. Create a security role that has a table filter on the Sales_Manager table where username = UserName(). |
| Case Study: Litware Inc Link: https://justpaste.it/7v59b You need to create a relationship between the Weekly_Returns table and the Date table to meet the reporting requirements of the regional managers. What should you do? • A. Add the Weekly_Returns data to the Sales table by using RELATED DAX functions. • B. In the Weekly_Returns table, create a new calculated column named date_id in a format of yyyymmdd and use the calculated column to create a relationship to the Date table. • C. Create a new table based on the Date table where date_id is unique, and then create a many-to-many relationship to Weekly_Return. | B. In the Weekly_Returns table, create a new calculated column named date_id in a format of yyyymmdd and use the calculated column to create a relationship to the Date table. |
| Case Study: Litware Inc Link: https://justpaste.it/7v59b You need to create relationships to meet the reporting requirements of the customer service department. What should you create? • A. an additional date table named ShipDate, a one-to-many relationship from Date[date_id] to Sales[Sales_date_id], and a one-to-many relationship from ShipDate[date_id] to Sales[sales_ship_date_id] • B. an additional date table named ShipDate, a many-to-many relationship from Sales[sales_date_id] to Date[date_id], and a many-to-many relationship from Sales[sales_ship_date_id] to ShipDate[date_id] • C. a one-to-many relationship from Date[date_id] to Sales[sales_date_id] and another one-to-many relationship from Date[date_id] to Weekly_Returns[week_id] • D. a one-to-many relationship from Sales[sales_date_id] to Date[date_id] and a one-to-many relationship from Sales[sales_ship_date_id] to Date[date_id] | A. an additional date table named ShipDate, a one-to-many relationship from Date[date_id] to Sales[Sales_date_id], and a one-to-many relationship from ShipDate[date_id] to Sales[sales_ship_date_id] |
|
Case Study: Litware Inc
Link: https://justpaste.it/7v59b
You need to create a visualization to meet the reporting requirements of the sales managers.
How should you create the visualization?
Image:
42 (binary/octet-stream)
|
Image:
43 (binary/octet-stream)
|
|
Case Study: Litware Inc
Link: https://justpaste.it/7v59b
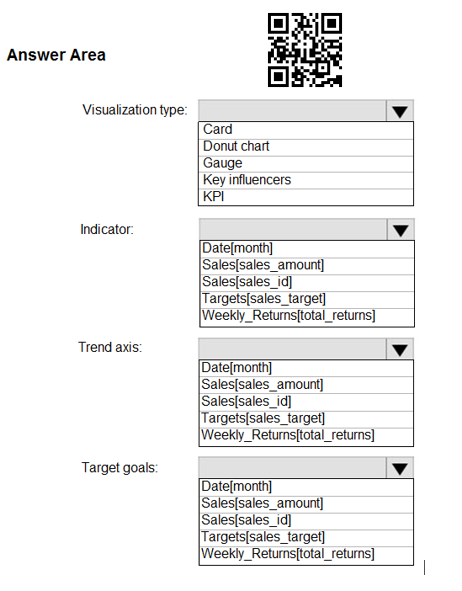
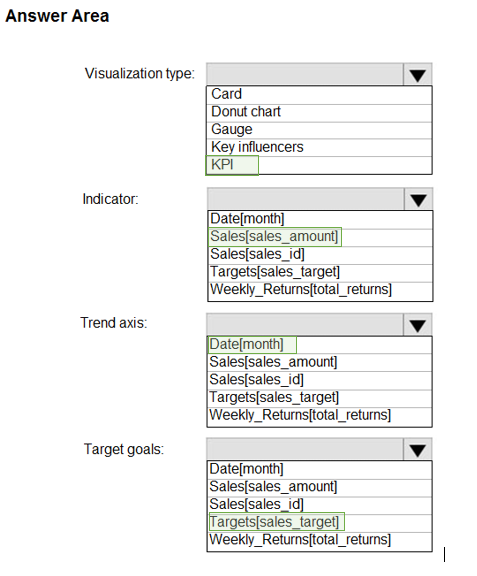
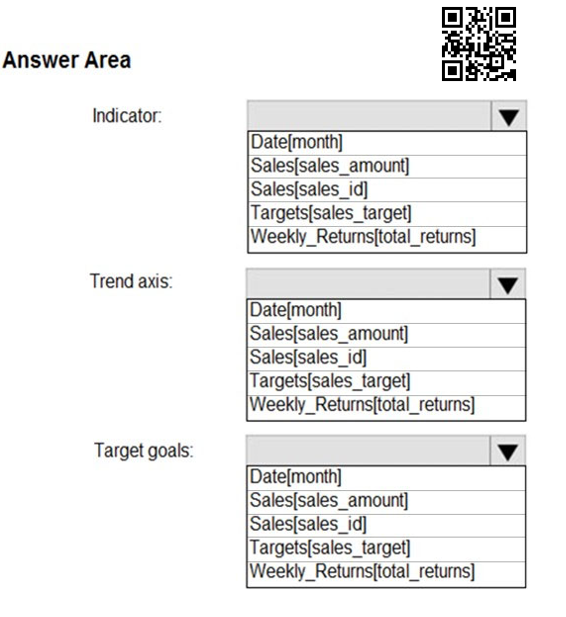
You need to create a KPI visualization to meet the reporting requirements of the sales managers.
How should you create the visualization?
Image:
44 (binary/octet-stream)
|
Image:
45 (binary/octet-stream)
|
|
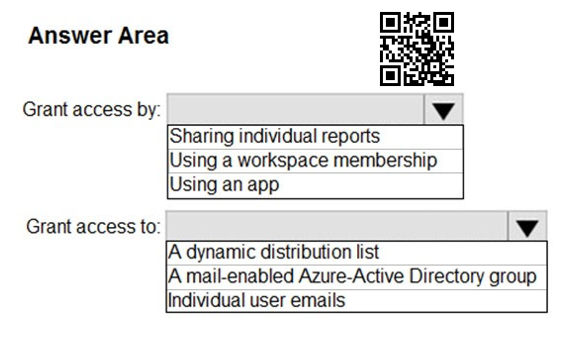
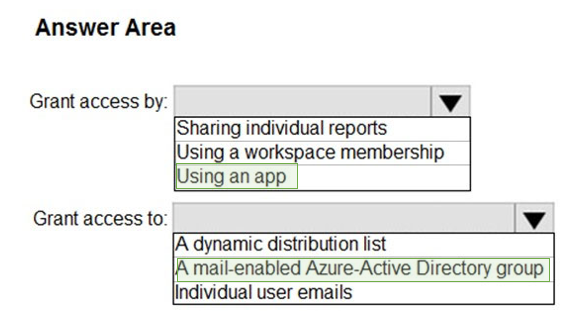
Case Study: Contoso Ltd.
Link: https://jpst.it/2EFLi
How should you distribute the reports to the board? To answer, select the appropriate options in the answer area
Image:
49 (binary/octet-stream)
|
Image:
50 (binary/octet-stream)
|
|
Case Study: Contoso Ltd.
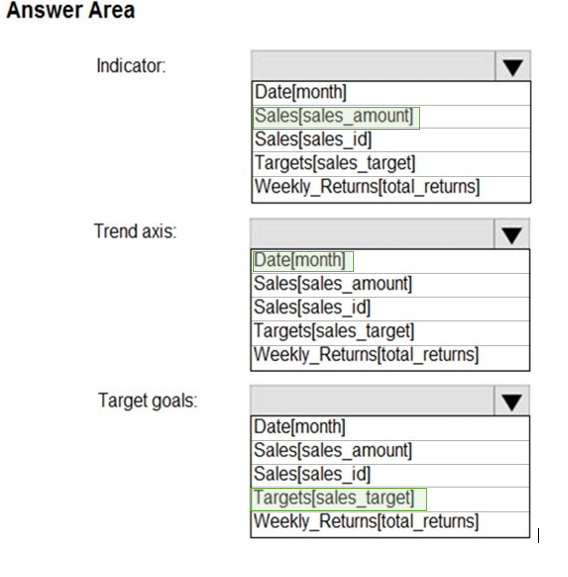
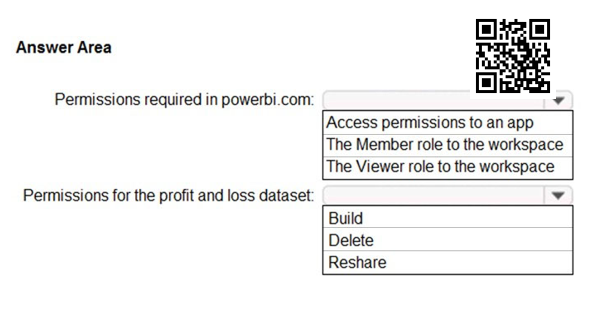
Link: https://jpst.it/2EFLi
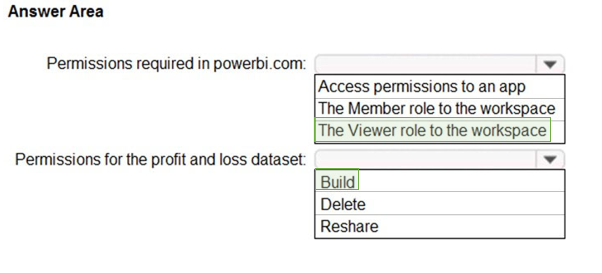
You need to grant access to the business unit analysts.
What should you configure? To answer, select the appropriate options in the answer area.
Image:
51 (binary/octet-stream)
|
Image:
52 (binary/octet-stream)
|
| Case Study: Contoso Ltd. Link: https://jpst.it/2EFLi What is the minimum number of Power BI datasets needed to support the reports? • A. two imported datasets • B. a single DirectQuery dataset • C. two DirectQuery datasets • D. a single imported dataset | D. a single imported dataset |
|
Case Study: Contoso Ltd.
Link: https://jpst.it/2EFLi
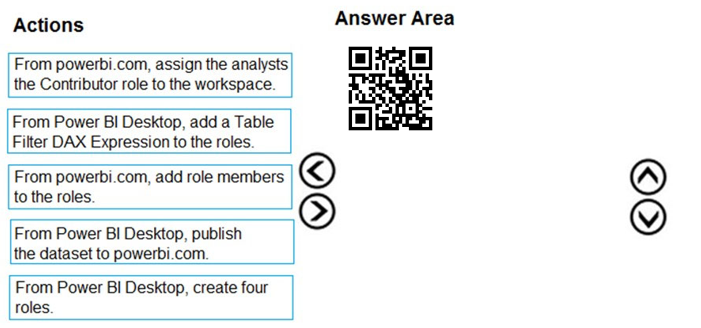
Once the profit and loss dataset is created, which four actions should you perform in sequence to ensure that the business unit analysts see the appropriate profit and loss data? To answer, move the appropriate actions from the list of actions to the answer area and arrange them in the correct order.
Select and Place:
Image:
53 (binary/octet-stream)
|
1. From Power BI Desktop, create four roles 2. From Bower BI Desktop, add a Table Filter DAX Expression to the roles 3. From Power BI Desktop, publish the dataset to powerbi.com 4. From powerbi.com, add role members to the roles |
| Case Study: Contoso Ltd. Link: https://jpst.it/2EFLi Which DAX expression should you use to get the ending balances in the balance sheet reports? • A. CALCULATE ( SUM( BalanceSheet [BalanceAmount] ), DATESQTD( 'Date'[Date] ) ) • B. CALCULATE ( SUM( BalanceSheet [BalanceAmount] ), LASTDATE( 'Date'[Date] ) ) • C. FIRSTNONBLANK ( 'Date' [Date] SUM( BalanceSheet[BalanceAmount] ) ) • D. CALCULATE ( MAX( BalanceSheet[BalanceAmount] ), LASTDATE( 'Date' [Date] ) ) | B. CALCULATE ( SUM( BalanceSheet [BalanceAmount] ), LASTDATE( 'Date'[Date] ) ) |
|
Case Study: Contoso Ltd.
Link: https://jpst.it/2EFLi
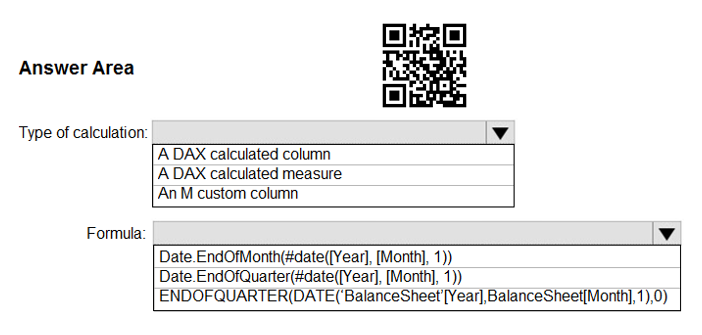
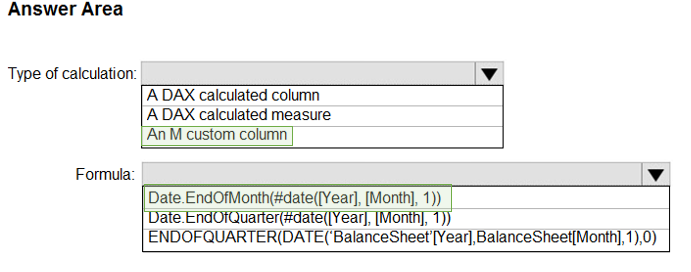
You need to calculate the last day of the month in the balance sheet data to ensure that you can relate the balance sheet data to the Date table.
Which type of calculation and which formula should you use?
Image:
54 (binary/octet-stream)
|
Image:
55 (binary/octet-stream)
|
|
Case Study: Contoso Ltd.
Link: https://jpst.it/2EFLi
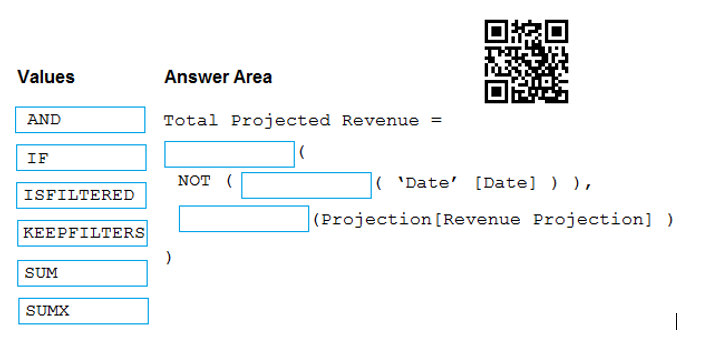
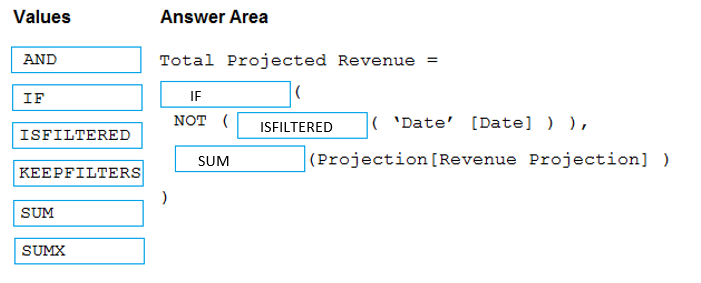
You need to create a DAX measure in the data model that only allows users to see projections at the appropriate level of granularity.
How should you complete the measure?
Image:
56 (binary/octet-stream)
|
Image:
57 (binary/octet-stream)
|
| Case Study: Contoso Ltd. Link: https://jpst.it/2EFLi Which two types of visualizations can be used in the balance sheet reports to meet the reporting goals? • A. a line chart that shows balances by quarter filtered to account categories that are long-term liabilities. • B. a clustered column chart that shows balances by date (x-axis) and account category (legend) without filters. • C. a clustered column chart that shows balances by quarter filtered to account categories that are long-term liabilities. • D. a pie chart that shows balances by account category without filters. • E. a ribbon chart that shows balances by quarter and accounts in the legend. | A. a line chart that shows balances by quarter filtered to account categories that are long-term liabilities E. a ribbon chart that shows balances by quarter and accounts in the legend. |
| Case Study: Northwind Trader Link: https://jpst.it/2EFWu You need to design the data model to meet the report requirements. What should you do in Power BI Desktop? • A. From Power Query, use a DAX expression to add columns to the Orders table to calculate the calendar quarter of the OrderDate column, the calendar month of the OrderDate column, the calendar quarter of the ShippedDate column, and the calendar month of the ShippedDate column. • B. From Power Query, add columns to the Orders table to calculate the calendar quarter and the calendar month of the OrderDate column. • C. From Power BI Desktop, use the Auto date/time option when creating the reports. • D. From Power Query, add a date table. Create an active relationship to the OrderDate column in the Orders table and an inactive relationship to the ShippedDate column in the Orders table. | D. From Power Query, add a date table. Create an active relationship to the OrderDate column in the Orders table and an inactive relationship to the ShippedDate column in the Orders table. |
|
Case Study: Northwind Trader
Link: https://jpst.it/2EFWu
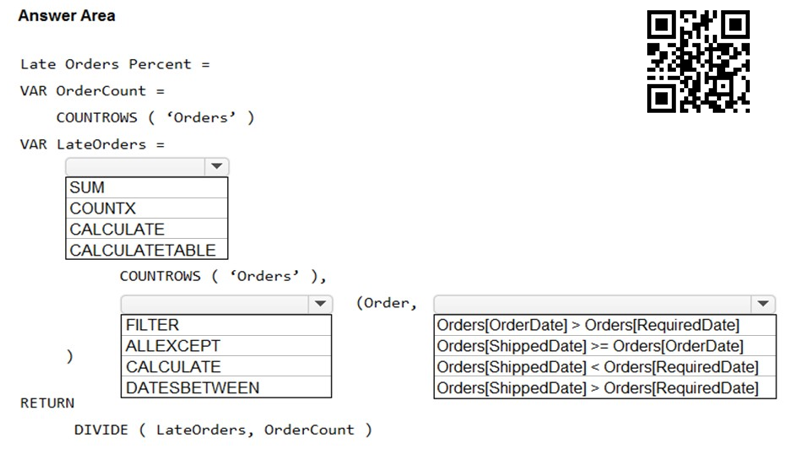
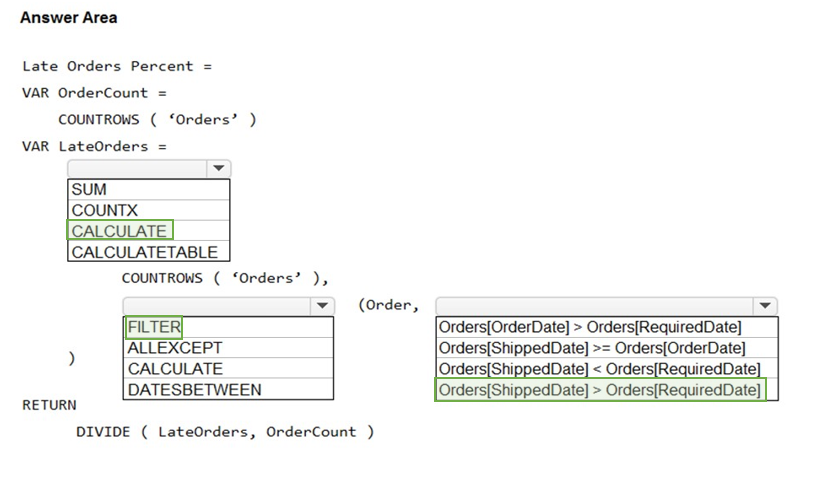
You need to create a measure that will return the percentage of late orders.
How should you complete the DAX expression?
Image:
66 (binary/octet-stream)
|
Image:
67 (binary/octet-stream)
|
|
Case Study: Northwind Trader
Link: https://jpst.it/2EFWu
You need to create a relationship in the dataset for RLS.
What should you do?
Image:
68 (binary/octet-stream)
|
Image:
69 (binary/octet-stream)
|
| Case Study: Northwind Trader Link: https://jpst.it/2EFWu You need to create the On-Time Shipping report. The report must include a visualization that shows the percentage of late orders. Which type of visualization should you create? • A. bar chart • B. scatterplot • C. pie chart | A. bar chart |
|
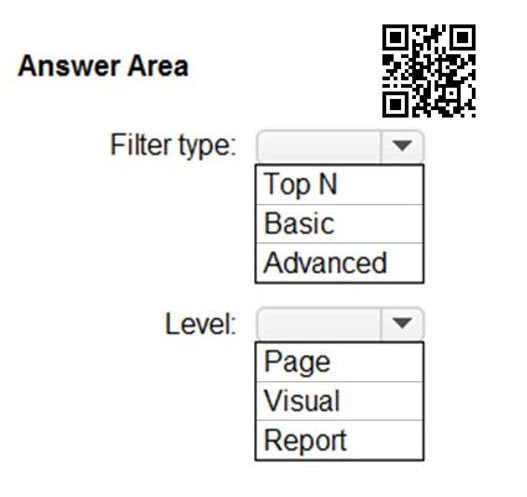
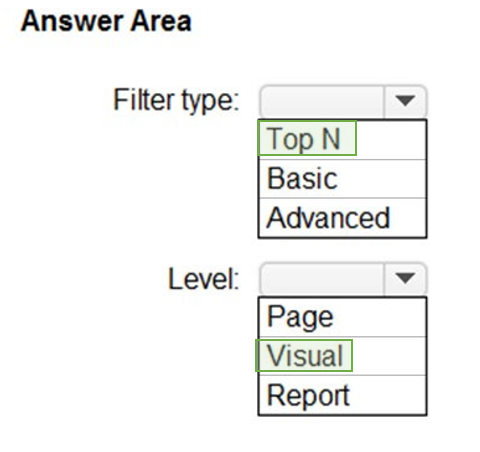
Case Study: Northwind Trader
Link: https://jpst.it/2EFWu
You need to create the Top Customers report.
Which type of filter should you use, and at which level should you apply the filter?
Image:
70 (binary/octet-stream)
|
Image:
71 (binary/octet-stream)
|




¿Quieres crear tus propias Fichas gratiscon GoConqr? Más información.