15576603
Descripción
Mapa Mental por Leonardo Galler, actualizado hace más de 1 año
|
|
Creado por Leonardo Galler
hace más de 7 años
|
|
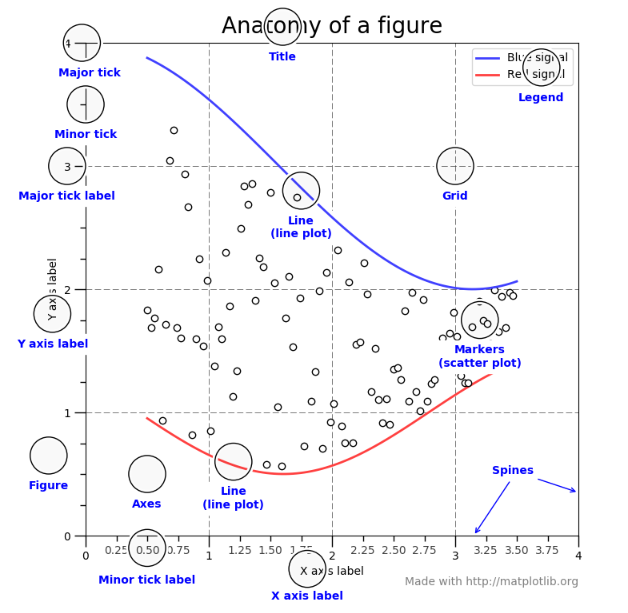
Matplotlib
Nota:
- Matplotlib trabalha com o conceito de figuras Importando matplotlib import matplotlib.pyplot as plt import numpy as np
- Figure
Nota:
- he whole figure. The figure keeps track of all the child Axes, a smattering of 'special' artists (titles, figure legends, etc), and the canvas. fig = plt.figure() # an empty figure with no axes fig.suptitle('No axes on this figure') # Add a title so we know which it is fig, ax_lst = plt.subplots(2, 2) # a figure with a 2x2 grid of Axes
- Axes
Nota:
- This is what you think of as 'a plot', it is the region of the image with the data space. A given figure can contain many Axes, but a given Axes object can only be in one Figure. The Axes contains two (or three in the case of 3D) Axis objects (be aware of the difference between Axes and Axis) which take care of the data limits (the data limits can also be controlled via set via the set_xlim() and set_ylim() Axes methods). Each Axes has a title (set via set_title()), an x-label (set via set_xlabel()), and a y-label set via set_ylabel()).
- Axis
Nota:
- These are the number-line-like objects. They take care of setting the graph limits and generating the ticks (the marks on the axis) and ticklabels (strings labeling the ticks). The location of the ticks is determined by a Locator object and the ticklabel strings are formatted by a Formatter. The combination of the correct Locator and Formatter gives very fine control over the tick locations and labels.
- Artist
Nota:
- Basically everything you can see on the figure is an artist (even the Figure, Axes, and Axis objects). This includes Text objects, Line2D objects,collection objects, Patch objects ... (you get the idea). When the figure is rendered, all of the artists are drawn to the canvas. Most Artists are tied to an Axes; such an Artist cannot be shared by multiple Axes, or moved from one to another.
- Inputs(Datatype)
Nota:
- All of plotting functions expect np.array or np.ma.masked_array as input. Classes that are 'array-like' such as pandas data objects and np.matrixmay or may not work as intended. It is best to convert these to np.array objects prior to plotting.
- Matplotlib, pyplot and pylab: how are they related?
Nota:
- Matplotlib is the whole package; matplotlib.pyplot is a module in matplotlib; and pylab is a module that gets installed alongside matplotlib. Pyplot provides the state-machine interface to the underlying object-oriented plotting library. The state-machine implicitly and automatically creates figures and axes to achieve the desired plot.
Recursos multimedia adjuntos
¿Quieres crear tus propios Mapas Mentales gratis con GoConqr? Más información.