2487480
Description
Flashcards by 09serukenyahol, updated more than 1 year ago
|
|
Created by 09serukenyahol
about 9 years ago
|
|
| Question | Answer |
| Demand | Quantity of a good or service that consumers are willing and able to purchase at a given price in a given time period. |
| The Law of demand states.. | As the price of a product fall, the demand for it increases (ceteris paribus) |
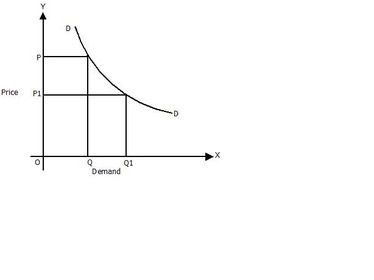
| Demand curve | |
| 'Consumers aim to maximise their utility' What does this mean? | They aim to maximise the satisfaction they gain from a good or service at a certain price |
| Demand curve negatively or positively sloping? | Negatively sloping. The curve can be a straight lie |
| Demand curve is a graph showing.... | how much will be demanded at any given price |
| Name the two effects concerned with the demand curve. - price determinants | The substitution effect - if you increase the price of a good, other substitutes will appear cheaper and therefore less is demanded The income effect - if the price of a good increases, your purchasing power falls and therefore you can not purchase as much |
| Name the non-price determinants of demand | 1. Income (consider normal & inferior goods) 2. The price of other products (substitues, complements & unrelated goods) 3. Tastes/ preferences 4. size of population 5. changes in age structure of population 5. change in income distribution 6. governmet policy changes 7. expectations 8. seasonal changes |
| Income | Normal goods = If the income of the consumer increases then demand increases. e.g. more people may buy plane tickets if they are cheaper. shift to the right Inferior goods = Demand for the product will fall as income rises and the consumer starts to buy higher prices substitutes in place of the inferior good. e.g instead of buying Sainsbury's basics chicken, you may buy steak. demand curve shifts left |
| Substitutes - give an example - what would the demand curves look like | You buy one or the other. If products are substitues, a change in the price of one will lead to a change in demand of the other e.g if price of chicken falls then quantity goes up and quantity demanded (Qd) of beef falls. Demand curve for beef shifts left. There is a movement along the demand curve for chicken |
| Complements | Products that are often purchased together e.g printers and ink cartridges. A change in price of one will lead to a change in demand of the other. |
| Unrelated goods | Change in the price of one product does not affect the demand of the other product e.g. toothpaste and shoes are unrelated goods |
| Tastes/ preferences | Demand is influenced by tases which is affected by advertising and fashion. e.g. if white cars are in fashion then demand for white cars will most likely increase |
| changes in size of population | If population increases then its likely that demand for products will increase. Demand curves shift right. |
| changes in structure of population | If age structure of economy changes, demand for certain products will be affected. e.g. in Sherborne (a town full of grannies basically) demand for zimmer frames will increase as the demand for roller skates fall because there are not many young people there. |
| change in income distribution | If there is a change in income distribution e.g. relatively poor are better off and the rich slightly worse off, there may be an increase in demand for necessity goods e.g meat = demand curve for meat shifts right |
| government policy changes | changes in direct taxes e.g income taxes on incomes may affect disposable income and thus their demand. Also gov policies such as compulsory seat belts/ ban on smoking in public places will affect demand in the relevant markets |
| expectations | If people expect price to increase they will buy sooner shifting demand right. |
| Seasonal changes | changes in season can lead to changes in demand e.g there will be less demand for Christmas trees during sprin compared with in December near christmas |
| Difference between 1. movement along the demand curve 2. shift in the demand curve | - when a non-price determinant has an effect on demand, there is a shift in the demand curve - when price of a good changes, this results in a movement along the demand curve |
| Linear demand function | Qd = a - bp Qd = quantity demanded a = quantity demanded if the price was 0 (x axis coordinate) b = gradient p = price If 'b' increases, the demand curve will be flatter If 'b' decreases, demand curve steepens |
Want to create your own Flashcards for free with GoConqr? Learn more.