4145271
Description
Flashcards by katie.langridge, updated more than 1 year ago
|
|
Created by katie.langridge
over 8 years ago
|
|
| Question | Answer |
| What is a marketing plan? | A marketing plan is a set of proposed marketing actions to be undertaken over a period of time. It would include: -Market research -Marketing objectives -Promotional strategies -The marketing budget -The marketing strategies |
| Internal influences on the marketing plan | -Finance: is the £ available to fund ambitious expansion plans? -Operational Issues: does the firm have the production facilities and the staff available to produce the products e.g. you aim to increase market share but have a capacity shortage problem. |
| External Influences on the marketing mix | -Competitors: a new entrance into the market may impact on the sales forecast in the marketing mix. -Environmental: e.g. guidelines on pollution -Marketing audit contains a SWOT analysis: Threats and weaknesses -PESTLE analysis: e.g. social, an ageing population influences the type of products that are being produced. |
| PESTLE | P = Political E = Economic S = Social T = Technological L = Legal E = Environmental |
| Advantages of the marketing plan | -Forces the company to be proactive rather than reactive -Motivation and informs staff -Marketing plans are drawn up in light of the objectives of the business, so there is more chance of theses objectives being achieved. |
| Disadvantages of the marketing plan | -Scarce resources, management and employee time is taken up in creating the plan. Therefore it is represents a big opportunity cost. -Marketing plan be be quite poorly written |
| Marketing Budget | How much £ the marketing department has within a certain accounting period. |
| Methods of setting budgets | Historical = Look at previous budgets in order to set the next years one Affordable = How much money the company can afford to spend Sales Based = Budget is based on a % of sales, e.g. budget is to be 10% of sales revenue. Revenue is £100, budget is £10 Competitors = Based on what competitors spend |
| Influencing factors on the budget | -Corporate aim and objectives -Competitors -Nature of the market and customers e.g. do you need to do promotion? |
| Benefits of budget | -Controls marketing costs and expenditures -Setting targets can motivate staff -Identifies inefficiencies and waste |
| Drawbacks of budgets | -Responding to sudden changes, e.g. a new competitor -Inaccuracy in the budget process causes poor decisions to be made e.g. inaccurate sales forecast -Unrealistic targets can demotivate staff |
| ANSOFF MATRIX | |
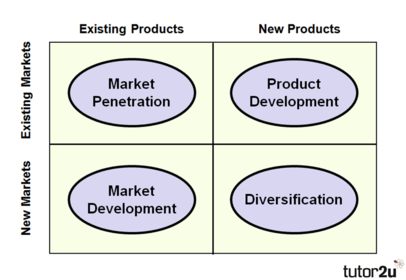
| What is Ansoff Matrix? | A model which identifies growth strategies for a business based on an analysis of their products and their markets. It measures the level of risk the company id taking with their growth strategies. |
| Market Led Strategies | When a business is market led, the businesses activities will be dictated by the market, it will at all times attempt to meet the needs of the market with little if any reference to internal strengths of the business. |
| Asset Led Strategies | A business which is asset led is responsive to the needs of the market but equally it takes into account its own strengths and weaknesses when producing a good or a service. |
| Michael Porter | Michael said a business can do one of the following ... Cost Leadership: A firm sets out to be the lowest cost producer in the industry. Differentiation: Making the product different from competitors, if consumers value this difference it benefits the firm in terms of increased sales volume and scope for charging higher prices. |
| Benefits of market research | -Most scientific method -Reduces risk of expensive mistakes -Helps find out what customers want |
| Drawbacks of market research | -Very expensive and time consuming -Need to do it regularly as market research changes -Often quantitative based means that less focus on qualitative research and gut instincts |
| Test Marekting | The aim of test marketing is to gather as much info possible about the market mix for a product/ service. It is tested usually on a geographical area, to discover customers opinions. |
| Moving averages + Extrapolation | Moving Averages = moving averages are calculated by combining data over a period of time in a way that smooths out fluctuating data. Extrapolation = Extrapolation uses previous patterns in numerical data to predict future values. |
| Extrapolating into the future using average sales increase | 1230 - 404 = 826 (7 years) = 826 826/ 7 = 118 units per year. |
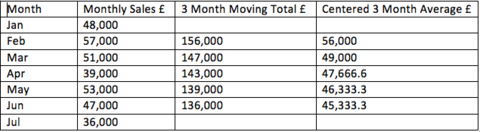
| Steps in calculating moving averages. | 1. Calculate a moving total (this is the total for a period of time which will be either 3 days, 3 weeks, months or 3 years). 2. Calculate a centred average. (this is the total for a period divided by 3) 3. Draw a line chart. |
| Moving Average Example | As you can see the monthly sales jump around forming no obvious pattern ... calculating the moving average will help to show any underlying trends. |
| What causes variations in the sales data? | Seasonal - sales will fluctuate if the product is seasonal e.g. easter eggs Cyclical - In line with the business economic cycle Random - No underlying cause for the fluctuation in sales. |
| What is a correlation? | The relationship between 2 variables. |
| Qualitative Sales Forecasting - The Delphi Technique | A 'delphi' begins with the initial development of a questionnaire focusing on the problem. A panel of experts is selected, then the questionnaire is sent to them. Responses to the questionnaire are summarised, then a further questionnaire is developed, based on findings of the first questionnaire, and is sent to the same panel of experts. |
| Qualitative Sales Forecasting - Brainstorming | The basis of the brainstorm is "the problem statement", this will be the single focus of discussions. Examples of problem statements might be "How can we improve our product range". Participants the discuss the statement generating new, useful ideas and promoting creative ideas. |
| Qualitative Sales Forecasting - Intuition | For products that are new to the market, or placed within immature markets, then the collection and examination of statistical evidence is much harder. In this situation, marketing and sales professionals are often rely on their understanding and knowledge of other markets and products, that may be similar in some way. |
| Price Elasticity of Demand | This is looking at how demand changes to a change in price. An increase in price will always lead to a decrease in demand, BUT it will not always lead to a decrease in revenue. Sometimes enough customers remain at the higher price to earn the company more revenue. The formula works this out for you, so it is an important step when a business decides whether to increase or decrease their price. |
| Revenue | Revenue is the amount of money the business receives from a sales transaction (don't confuse with profit). Can calculate it by doing: PRICE X QUANTITY Example: I sell 500 cans of coke at 0.25p: 500 x 0.25 = £125 (revenue) |
| Formulas for Price Elasticity of Demand | Percentage Change: (old - new) / old x 100 Price Elasticity of Demand: Percentage change in quantity demanded / Percentage change in price |
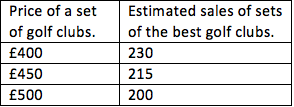
| 1. £500 - £450 = £50 (£50 / £500) x 100 = £10 2. 200 - 215 = -15 (ignore the negative) (15/ 200) x 100 = 7.5 3. 7.5 / 10 = 0.75 INELASTIC | Calculate the price elasticity of demand for a set of golf clubs if he decides to lower their price from £500 to £450. (3) |
| What does price elasticity of demand figures actually mean? | - If the answer is less than 1, the product is INELASTIC: not as sensitive customers. An increase in price means less customers but more revenue. - If the answer is more than 1, the product is ELASTIC: An increase in price means less customers and less revenue. |
| Re-working the formula | If the percentage change in price was 10% and the PED is 1.2. What must the percentage change in demand be? |
| Income Elasticity of Demand | The responsiveness of quantity demanded to a change in income. FORMULA: percentage change in quantity demanded / percentage change in income |
| The demand for some products will change significantly with the change in income, for other products the demand will not change significantly with income. E.g The demand for bread will not change significantly with income unlike luxury holidays that will. | If income rises by 6% and demand rises by 12% the change in demand is proportionately greater and these would be described as income elastic (cars, luxury goods, fashion items etc). However if income rose by 6% and demand rose by 5%, then it is income inelastic because the percentage change in demand is proportionately less than the change in income (essential goods e.g. milk and fuel) |
| Income Elasticity of Demand: -Answer greater than 1 = income elastic (DEMAND CHANGE IS GREATER THAN INCOME CHANGE) -Answer less than 1 = income inelastic (DEMAND CHANGE IS LESS THAN THE CHANGE IN INCOME) | The figure will also tell you if it is a normal or an inferior good. A normal good (income rises = demand rises) the answer will be positive. An inferior good (income rises = demand decreases) the answer will be negative. |
| Interpreting Income Elasticity of Demand | 0.6 = Inelastic = Normal -2.4 = Elastic = Inferior 1.9 = Elastic = Normal -0.8 = Inelastic = Inferior |
Want to create your own Flashcards for free with GoConqr? Learn more.