8388381
Description
Flowchart by Alex Burden, updated more than 1 year ago
|
|
Created by Alex Burden
almost 9 years ago
|
|
Flowchart nodes
- Point Estimation
- Estimatior - any statistic to estimate a characteristic of a population
- Unbiased estimator is denoted by: E(T)=α
- The most efficient and best estimator for α, is the estimator that:is unbiasedhas the smallest variance
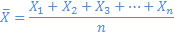
- Most Efficient of Population Mean
- Unbiased Estimator:
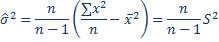
- Most Efficient of Population Variance
- Best unbiased estimator of population variance: σ̂^2S^2 = variance of the sample
- Can also be noted as
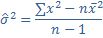
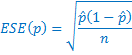
- Best Unbiased Estimator of a Probability/Proportion
- X~Bin(n,α)unbiased estimator: Estimated Standard Error: p̂=Ps where Ps = sample proportion
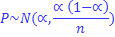
- Distribution of the Sample Proportion
- For both np>5 and nq>5 a continuity correction needs to be used.If n>30, by C.L.T. :- Continuity correction for is: if using equation above
Want to create your own Flowcharts for free with GoConqr? Learn more.