1179928
Description
Mind Map by Alejandro Baruch, updated more than 1 year ago
|
|
Created by Alejandro Baruch
over 9 years ago
|
|
Calculo Diferencial - Module 1
"Probability and Statistics"(2)
- Alejandro Baruch Saucedo Esparza - A01400284
- Lic. Saúl Garcia
- Lic. Saúl Garcia
- Probability and Statistics
- Statistics: The science of collecting, describe, analyze, and interpret data.
- Descriptive Statistics
- Collection, organization,
overview and presentation of
sample data. Main tools:
Tables of Numbers, Graphs
and calculated quantities.
- Collection, organization,
overview and presentation of
sample data. Main tools:
Tables of Numbers, Graphs
and calculated quantities.
- Inferential Statistics
- Obtaining inferences or
conclusions (via conjectures)
about populations based on
information taken from the
samples.
- Concepts
- Population or Universe: The
totality of the elements or
things under consideration
- Parameter: Measure of
overview that is
calculated to describe
a characteristic of a
population.
- Parameter: Measure of
overview that is
calculated to describe
a characteristic of a
population.
- Sample: The
portion of the
Population that is
selected for the
analysis.
- Statistic: Measure of
overview that is calculated
to describe a characteristic
of a single sample of the
population.
- Statistic: Measure of
overview that is calculated
to describe a characteristic
of a single sample of the
population.
- Random Variable:
Phenomena,
characteristics or values
that is subject to variations
due to chance
- Qualitative random variables
- Produce categorical responses
to describe an element of a
population
- Quantitative random variables
- Discrete: Numerical
responses arising from a
process of counting
- Continuous:
Responses arising
from a process of
measurement.
- Discrete: Numerical
responses arising from a
process of counting
- Produce categorical responses
to describe an element of a
population
- Qualitative random variables
- Population or Universe: The
totality of the elements or
things under consideration
- Obtaining inferences or
conclusions (via conjectures)
about populations based on
information taken from the
samples.
- Descriptive Statistics
- Measurement Scales
- Properties
- Identity
- Each value on the
measurement scale has a
unique meaning.
- Each value on the
measurement scale has a
unique meaning.
- Magnitud
- Values on the measurement scale
have an ordered relationship to one
another. That means some values are
larger and some are smaller.
- Values on the measurement scale
have an ordered relationship to one
another. That means some values are
larger and some are smaller.
- Equal Intervals
- Scale units along the scale are
equal to one another. This means
that the difference between 1 and 2
would be equal to the difference
between 19 and 20.
- Scale units along the scale are
equal to one another. This means
that the difference between 1 and 2
would be equal to the difference
between 19 and 20.
- Minimum value of zero
- The scale has a true zero
point, below which no
values exist.
- The scale has a true zero
point, below which no
values exist.
- Identity
- Nominal Scale of Measurement
- Satisfies the identity property of
measurement. Values assigned to
variables represent a descriptive
category, but have no inherent
numerical value with respect to
magnitude.
- Example:Gender..
Individuals may be classified
as "male" or "female", but
neither value represents
more or less "gender" than
the other
- Example:Gender..
Individuals may be classified
as "male" or "female", but
neither value represents
more or less "gender" than
the other
- Satisfies the identity property of
measurement. Values assigned to
variables represent a descriptive
category, but have no inherent
numerical value with respect to
magnitude.
- Ordinal Scale of Measurement
- Scale has the property of
both identity and magnitude.
Each value on the ordinal
scale has a unique meaning,
and it has an ordered
relationship to every other
value on the scale.
- Example:The results of a
horse race, reported as
"win", "place", and "show".
We know the rank order in
which horses finished the
race.
- Example:The results of a
horse race, reported as
"win", "place", and "show".
We know the rank order in
which horses finished the
race.
- Scale has the property of
both identity and magnitude.
Each value on the ordinal
scale has a unique meaning,
and it has an ordered
relationship to every other
value on the scale.
- Interval Scale of Measurement
- Has the properties of identity,
magnitude, and equal intervals. With
an interval scale, you know not only
whether different values are bigger or
smaller, you also know how much
bigger or smaller they are.
- Example: The Fahrenheit scale to measure
temperature. The scale is made up of equal
temperature units, so that the difference
between 40 and 50 degrees Fahrenheit is
equal to the difference between 50 and 60
degrees Fahrenheit.
- Example: The Fahrenheit scale to measure
temperature. The scale is made up of equal
temperature units, so that the difference
between 40 and 50 degrees Fahrenheit is
equal to the difference between 50 and 60
degrees Fahrenheit.
- Has the properties of identity,
magnitude, and equal intervals. With
an interval scale, you know not only
whether different values are bigger or
smaller, you also know how much
bigger or smaller they are.
- Ratio Scale of Measurement
- Satisfies all four of the properties
of measurement: identity,
magnitude, equal intervals, and a
minimum value of zero.
- Example: The weight of an object. Each value
on the weight scale has a unique meaning,
weights can be rank ordered, units along the
weight scale are equal to one another, and the
scale has a minimum value of zero.
- Example: The weight of an object. Each value
on the weight scale has a unique meaning,
weights can be rank ordered, units along the
weight scale are equal to one another, and the
scale has a minimum value of zero.
- Satisfies all four of the properties
of measurement: identity,
magnitude, equal intervals, and a
minimum value of zero.
- Properties
- Sampling methods
- The way that observations are
selected from a population to be in
the sample for a sample survey.
- Population parameter. A population
parameter is the true value of a population
attribute.
- Sample statistic. A sample statistic is
an estimate, based on sample data, of
a population parameter. Is strongly
affected by the way that sample
observations are chosen; that is by the
sampling method.
- Population parameter. A population
parameter is the true value of a population
attribute.
- Sample survey: Estimate
the value of some
attribute of a population.
- • Probability samples.
- Each population element has a
known (non-zero) chance of being
chosen for the sample.
- Each population element has a
known (non-zero) chance of being
chosen for the sample.
- Non-probability samples
- We do not know the probability that
each population element will be chosen,
and/or we cannot be sure that each
population element has a non-zero
chance of being chosen.
- Advantages:convenience and cost.
Disadvantages: Do not allow you to
estimate the extent to which sample
statistics are likely to differ from
population parameters.
- Advantages:convenience and cost.
Disadvantages: Do not allow you to
estimate the extent to which sample
statistics are likely to differ from
population parameters.
- • Voluntary sample
- A voluntary sample is
made up of people who
self-select into the survey.
- A voluntary sample is
made up of people who
self-select into the survey.
- • Convenience sample
- A convenience sample is
made up of people who are
easy to reach.
- A convenience sample is
made up of people who are
easy to reach.
- We do not know the probability that
each population element will be chosen,
and/or we cannot be sure that each
population element has a non-zero
chance of being chosen.
- Probability sampling methods:
They guarantee that the sample
chosen is representative of the
population. This ensures that
the statistical conclusions will be
valid.
- Simple random sampling
- Any sampling method that has the
following properties. o The population
consists of N objects. o The sample
consists of n objects. o If all possible
samples of n objects are equally likely
to occur, the sampling method is called
simple random sampling.
- A good example would be the
lottery method. Each of the N
population members is assigned a
unique number. The numbers are
placed in a bowl and thoroughly mixed.
Then, a blind-folded researcher selects
n numbers.
- A good example would be the
lottery method. Each of the N
population members is assigned a
unique number. The numbers are
placed in a bowl and thoroughly mixed.
Then, a blind-folded researcher selects
n numbers.
- Any sampling method that has the
following properties. o The population
consists of N objects. o The sample
consists of n objects. o If all possible
samples of n objects are equally likely
to occur, the sampling method is called
simple random sampling.
- Stratified sampling
- The population is divided into groups, based on some
characteristic. Then, within each group, a probability sample
(often a simple random sample) is selected. In stratified
sampling, the groups are called strata.
- Ex: a national survey. Divide the population
into groups or strata, based on geography -
north, east, south, and west. Then, within
each stratum, we might randomly select
survey respondents
- Ex: a national survey. Divide the population
into groups or strata, based on geography -
north, east, south, and west. Then, within
each stratum, we might randomly select
survey respondents
- The population is divided into groups, based on some
characteristic. Then, within each group, a probability sample
(often a simple random sample) is selected. In stratified
sampling, the groups are called strata.
- Cluster sampling
- Every member of the population is assigned to one,
and only one, group. Each group is called a cluster. A
sample of clusters is chosen, using a probability
method (often simple random sampling). Only
individuals within sampled clusters are surveyed.
- The difference between cluster sampling and
stratified sampling. With stratified sampling, the
sample includes elements from each stratum.
With cluster sampling, in contrast, the sample
includes elements only from sampled clusters.
- The difference between cluster sampling and
stratified sampling. With stratified sampling, the
sample includes elements from each stratum.
With cluster sampling, in contrast, the sample
includes elements only from sampled clusters.
- Every member of the population is assigned to one,
and only one, group. Each group is called a cluster. A
sample of clusters is chosen, using a probability
method (often simple random sampling). Only
individuals within sampled clusters are surveyed.
- Multistage sampling
- We select a sample by
using combinations of
different sampling
methods.
- We select a sample by
using combinations of
different sampling
methods.
- Systematic
random sampling
- We create a list of every member of the population. From the list,
we randomly select the first sample element from the first k
elements on the population list. Thereafter, we select every kth
element on the list.
- This method is different from simple random sampling since
every possible sample of n elements is not equally likely.
- This method is different from simple random sampling since
every possible sample of n elements is not equally likely.
- We create a list of every member of the population. From the list,
we randomly select the first sample element from the first k
elements on the population list. Thereafter, we select every kth
element on the list.
- Simple random sampling
- The way that observations are
selected from a population to be in
the sample for a sample survey.
- Frequency Distribution
- Data set with large numbers
- Grouped Frequency Distribution
- Data
- lower class limits, upper class limits, class width, class mark
- lower class limits, upper class limits, class width, class mark
- Guidelines
- Make sure each data item will fit into one
- Try to make all class the same width
- Make sure the classes do not overlap
- Use from 5 to 12 classes(too few or to many classes can
obscure the tendencies in the data
- Make sure each data item will fit into one
- Data
- Grouped Frequency Distribution
- Frequency
- How many times an event happens
- How many times an event happens
- Relative Frequency
- Frequency over total
elements given in percentage
- Frequency over total
elements given in percentage
- Visual displays of data
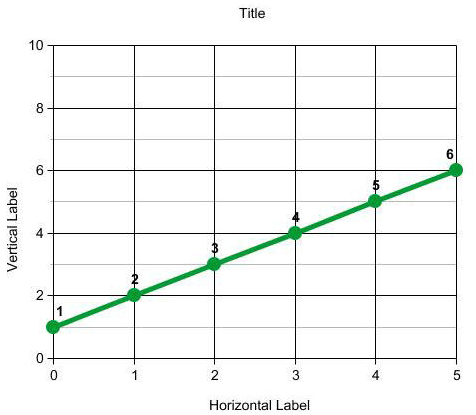
- Line
Graphs(polygon
of frequencies)
- To demonstrate how a
quantity changes
respect to something.
- To demonstrate how a
quantity changes
respect to something.
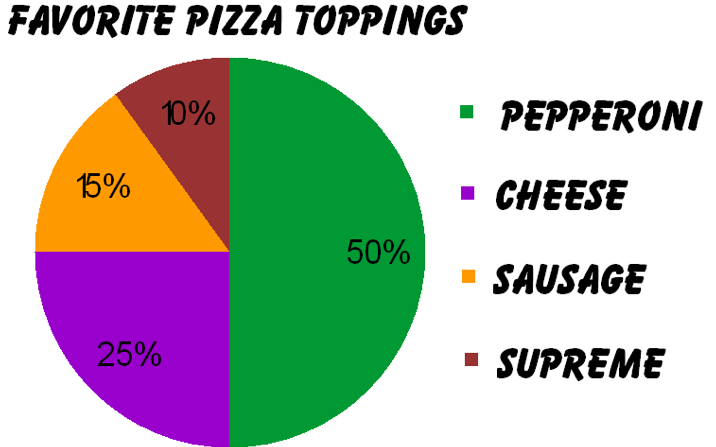
- Circle Graphs
- Uses a circle to represent
the total of all the categories
and divides circle into
sections which sizes show
the relative magnitudes of
the categories. 360º=100%
- Uses a circle to represent
the total of all the categories
and divides circle into
sections which sizes show
the relative magnitudes of
the categories. 360º=100%
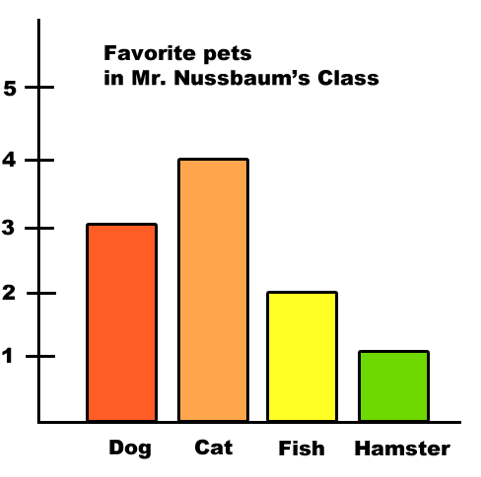
- Bar Graphs
- Frequency distribution of non-numerical
observation bars are not touching one
another and sometimes are arranged
horizontally rather than vertically.
- Frequency distribution of non-numerical
observation bars are not touching one
another and sometimes are arranged
horizontally rather than vertically.
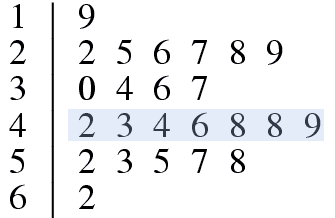
- Stem and leaf graphs
- Numbers Grouped(min. to solve an exam)
- Numbers Grouped(min. to solve an exam)
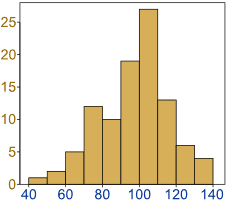
- Histogram
- Aseries of rectangles whose
lengths represent the
frequencies, are placed next to
another.
- Aseries of rectangles whose
lengths represent the
frequencies, are placed next to
another.
- Line
Graphs(polygon
of frequencies)
- Data set with large numbers
- Measures of central tendencies
- Mean
- Average: Most common measure.
Addition of all items and then diving
the sum by the number of items.
- Average: Most common measure.
Addition of all items and then diving
the sum by the number of items.
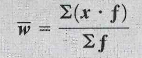
- Weightened mean
- Sum of all products of items
weighting factors, divided by
the sum of all weighting
factors.
- Sum of all products of items
weighting factors, divided by
the sum of all weighting
factors.
- Median
- Is not so sensitive to extreme
values. Divides a groups of
numbers into two parts, with
half the numbers below the
median and half above it
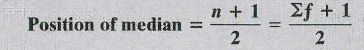
- Position of the median
- Frequency Distribution
- Frequency Distribution
- Steps to find it
- 1. Rank items(airing them in numerical order from
least to greatest) 2.if number odd, median is the
middle list. 3. Every median is mean of the 2 middle
items.
- 1. Rank items(airing them in numerical order from
least to greatest) 2.if number odd, median is the
middle list. 3. Every median is mean of the 2 middle
items.
- Position of the median
- Mode
- value that occurs more often
- value that occurs more often
- Is not so sensitive to extreme
values. Divides a groups of
numbers into two parts, with
half the numbers below the
median and half above it
- Mean
- Measures of dispersion
- Range
- A straight forward measure of dispersion.
Range=(the greatest value in the set- the
least value in the set.
- A straight forward measure of dispersion.
Range=(the greatest value in the set- the
least value in the set.
- Standard deviation
- Based on deviations from
the mean at data value
- Steps
- Based on deviations from
the mean at data value
- Coefficient of variation
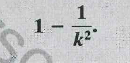
- Chevyshev´s theorem
- For any set of numbers regardless of how they are
distributed, the fraction of them that lie within K standard
deviations of their mean (where k>1) is at least
- k= numbers of
standard deviations
- k= numbers of
standard deviations
- For any set of numbers regardless of how they are
distributed, the fraction of them that lie within K standard
deviations of their mean (where k>1) is at least
- Range
- Measures of position
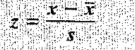
- z-score
- Percentiles
- If approximately n percent of the items in a distribution
re less than the number x, then x is the nth percentile
of the distribution, denoted Pn
- If approximately n percent of the items in a distribution
re less than the number x, then x is the nth percentile
of the distribution, denoted Pn
- Deciles and Quartiles
- Deciles are the nine values(denoted D1-D9) along the scale that divide
a data set into ten(approximately) equal-sized parts, and quartiles are
the thress values(Q1-Q3)that divide a data set into 4 (approximately)
equal-sized parts.
- Deciles are the nine values(denoted D1-D9) along the scale that divide
a data set into ten(approximately) equal-sized parts, and quartiles are
the thress values(Q1-Q3)that divide a data set into 4 (approximately)
equal-sized parts.
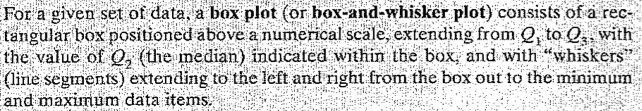
- Box plot
- z-score
- Statistics: The science of collecting, describe, analyze, and interpret data.
Media attachments
Want to create your own Mind Maps for free with GoConqr? Learn more.