Page 1
Units: (1.1)
Kilogram (kg)Metre (m)Metre/second (m/s) Metre/second2 (m/s2)Newton (N)Second (S)Kilogram metre/second (Kg m/s)Newton per kilogram (N\kg)
Speed distance and time graphs
Average speed= distance
(m/s) (m) (S)
In physics speed is measured in: meters per second
If a car travles 300m in 20sits speed is 15m/s
Distance time graphs
The vertical axis of a distance-time graph is the distance travelled from the start, and the horizontal axis is the time taken from the start. When an object is stationary, the line on the graph is horizontal. When an object is moving at a steady speed, the line on the graph is straight, but sloped. The diagram shows some typical lines on a distance-time graph.
Note that the steeper the line, the greater the speed of the object. The blue line is steeper than the red line because it represents an object moving faster than the object represented by the red line.The red lines on the graph represent a typical journey where an object returns to the start again. Notice that the line representing the return journey slopes downwards.Changes in distances in one direction are positive, and negative in the other direction. If you walk 10m away from me, that can be written as +10m; if you walk 3m towards me, that can be written as –3 m.
Acceleratioon and velocity -time graphs(1.3,1.5)
Velocity The velocity of a body is its speed in any given direction. An airplane can loop at a constant speed. However its velocity changes as its direction of motion changes.
Acceleration= velocity (change)
______________
(time taken)
time
_________
(m/s2)
(m/s)
(s)
a=(v-u)/t
Why is acceleration measured in m/s2?
velocity change is measured in m/s time taken is meausred in s therefore accleration= m/s /s = m/s2
Velocity - time graphs (1.8)
Converting from km/h to m/s160 km/h = 160 x1000
_____________
60 x 60
1000m in a km
60 seconds in 1 minute
60 minutes in 1 hour
The gradient of a velocity- time graph represents acceleration. The area under a velocity- time graph represents distance travelled. ( under the line)
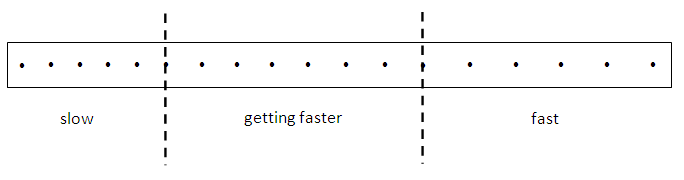
Speed investigates using ticker tape.
A ticker timer machine makes a series of dots on a paper tape moving through the machine. Usually they make 50 dots each second. The quicker the tape goes through the machine, the dots are further apart. The slower the tape goes through the machine, the closer together the dots are. They can be used to investigate speed or acceleration. The tape is cut into lengths representing equal time, and used to make speed time graphs. Every 5 dots on the tape shows distance moved in 0.15. You can work out the velociy using this equation: velocity= distance (length of tape)/ time (0.1) seconds.
Decleration
Deceleration means slowing down . This means that a decelerating object will have a smaller final velocity than its starting velocity. If you use the equation for finding the acceleration of an abject that is slowing down, the answer will have a negative sign, meaning declaration.
Plot and interpret distance- time graphs(1.2)
A distance time graph is a graph showing the relationship between distance travelled and time taken.Drawing a distance time graphThe Y axis should be the distance travelled from the start, meaning the bottom is time.To plot simply mark the distance travelled at every chosen point of time: e.g every second.Interpreting distance time graphsA strait line is a stationary object: because time is still going forward but the object is not moving up or down the distance axis.A line upwards is a object moving away from the start; a downward line is a object moving towards the start.The steeper the line the faster the object: its doing more distance for time- more up for across.To get a speed see how much up it goes for across. (the graph on the link below goes two up for one across that's two meters per second (2m/s))
Describe experiments to investigate the motion of everyday obkects such as toy cars or tennis balls.(1.4)
Plot and interpret veloccity time graphs(1.6)
Plotting On the Y axis of a distance time graph is velocity- speed travelled in a give direction. On the X axis is time taken from start. Note that negative velocities mean something is travelling in the opposite direction to that of the positive velocity.InterpretingA line going diagonally upwards shows an acceleration, if it is straight it is a constant acceleration. This is because acceleration is change in velocity over time.A line going diagonally down wards shows a deceleration. A straight downwards line shows constant deceleration. Again deceleration is change velocity over time but the velocity is decreasing.The steeper the line the more rapid the acceleration because the velocity us changing over less time. A straight line is a constant velocity: you are travelling at one speed in one direction.
1.7 determine acceleration from the gradient of a velocity-time graph Acceleration is measured in meters per second per second: m/s/s or m/s². This means we need to find out how many m/s are travelled every s. Which is the same as change in velocity over time. We can work this out by looking at a time period in the graph and seeing how much the velocity changes. For example on this graph between second 3 and second 4 the velocity changes from 0 to 4: meaning that it changes 4 m/s every 1s 4/1= 4m/s² So effectively you do up divided by across to give acceleration. (bbc)
You could plot the time it takes for a toy car to travel and then plot a distance time graph. Then repeat at different speeds and compare the different graphs.Alternatively, you could use a ticker tape; this makes a mark every second on the tape. If you attach the car to the end of the tape, its speed will be recorded: distance/dots = speed. For example, if you has 50 dots on a meter tape then it traveled at an average speed of (1/50) 0.02 meters per second.
- units& distance time graphs
New Page
Want to create your own Notes for free with GoConqr? Learn more.