11893650
Descrição
FlashCards por Elliemae Close, atualizado more than 1 year ago
|
|
Criado por Elliemae Close
quase 8 anos atrás
|
|
| Questão | Responda |
|
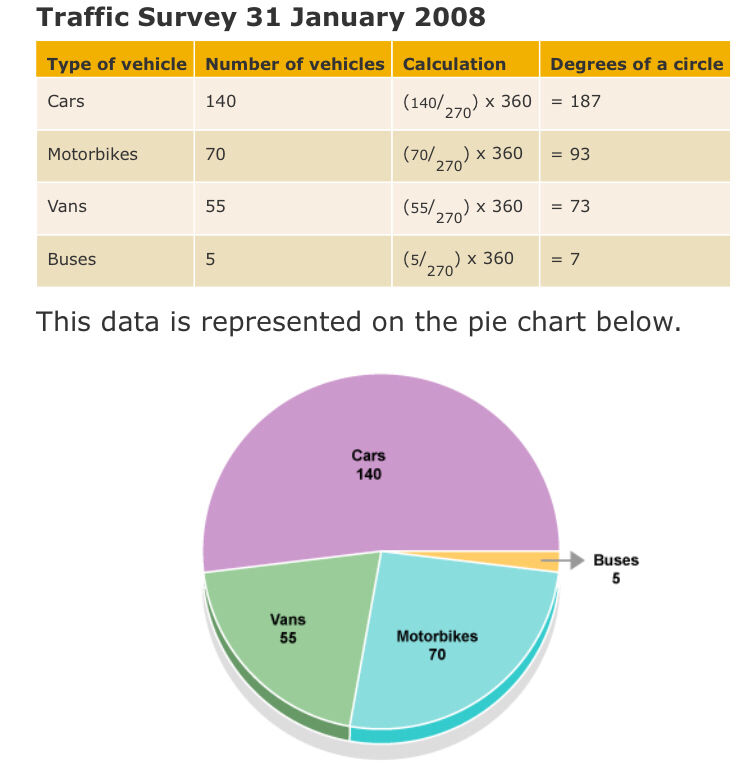
Pie chart angles must be represented as a proportion of 360 degrees
Image:
Mobile upload (image/jpeg)
|
Example, 55/270 vehicles are vans 55/270x360=73 degrees YOU NEED A PROTRACTOR |
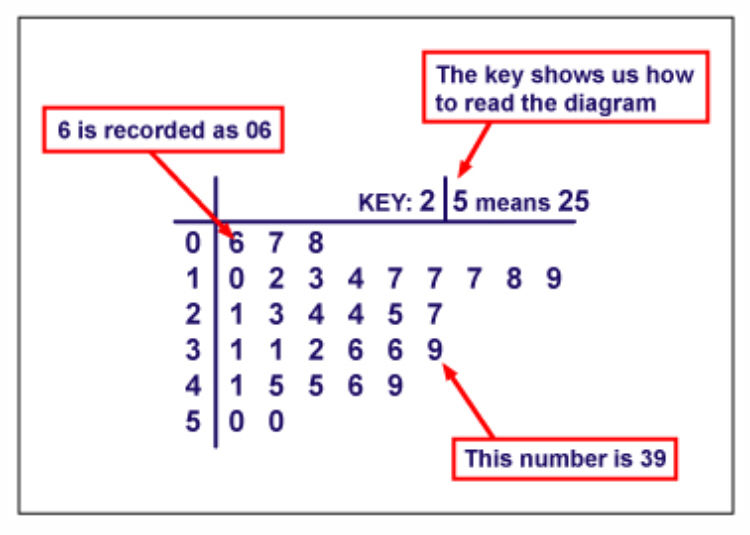
| What must a stem and leaf diagram always have? | A key |
| Turn over for image of a stem and leaf diagram |
Enter text here...
Image:
Mobile upload (image/jpeg)
|
| How would you represent the number 8 on a stem and leaf diagram? | 0|6 |
| How would you represent the number 26 on a stem and leaf diagram? | 2|6 |
| State the numbers on this diagram, 0|6 9 7 1|2 4 8 2|7 9 3 3|7 5 0 4|1 5 4 5|0 8 5 | 6, 9, 7 12,14,18 27,29,23 37,35,30 41,45,44 50, 50, 55 |
| What is ‘cumulative frequency?’ | The cumulative frequency is obtained by adding up the frequencies as you go along, to give a 'running total’ |
| What is mode | The most common |
| What is median | The middle |
| What is mean | Sum of data/amount of data |
| What is range | The difference between the largest and smallest number |
Quer criar seus próprios Flashcards gratuitos com GoConqr? Saiba mais.