1434127
Descrição
Mapa Mental por jonesj@ellowes.dudle, atualizado more than 1 year ago
|
|
Criado por jonesj@ellowes.dudle
mais de 11 anos atrás
|
|
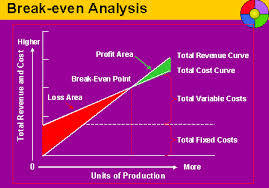
Break Even Analysis
- Fixed costs are costs that
do not change no matter
how much is produced.
- Rent, Advertising,
Interest payments on
loans.
- Rent, Advertising,
Interest payments on
loans.
- Variable costs are costs that
change depending on the
output.
- Electricity costs,
Overtime pay, Raw
Materials, Maintenance
of machinery.
- Electricity costs,
Overtime pay, Raw
Materials, Maintenance
of machinery.
- Break Even Analysis is
the point at which the
sales are exactly the
same as the costs.
- Break Even Analysis
shows us the Total costs,
Sales Revenue and
Profit.
- Fixed costs divided by selling
price-variable costs per unit.
- Graphs 1.This is done by first
working out the fixed and
variable costs at each unit of
output.
- Graphs 2. Then you fill in what
the revenue is at each stage
and add up the costs.
- Graphs 2. Then you fill in what
the revenue is at each stage
and add up the costs.
- Graphs 1.This is done by first
working out the fixed and
variable costs at each unit of
output.
- Fixed costs divided by selling
price-variable costs per unit.
- Contribution=selling
price per unit-variable
costs per unit.
- Revenue=selling
price*quantity sold.
- Margin of
safety=output-break
even point.
- Total Costs=fixed
costs + variable costs.
- Total Costs=fixed
costs + variable costs.
- Margin of
safety=output-break
even point.
- Revenue=selling
price*quantity sold.
- Break Even Analysis
shows us the Total costs,
Sales Revenue and
Profit.
- The break even point
informs the business
how many products
they need to sell so
their total revenue
equals the total costs.
- Spreadsheets/ICT is a
good way to work out the
break even point as it is a
good software to produce
graphs and charts, you can
share it via internet and its
simple to change .
- Spreadsheets/ICT is a
good way to work out the
break even point as it is a
good software to produce
graphs and charts, you can
share it via internet and its
simple to change .
- Limitations-If new rivals enter
the market or an
economic recession
starts that it can take
longer to reach the
break even point than
anticipated.
Anexos de mídia
Quer criar seus próprios Mapas Mentais gratuitos com a GoConqr? Saiba mais.