13885287
Description
Quiz by ELITE IIVII, updated more than 1 year ago
|
|
Created by ELITE IIVII
over 7 years ago
|
|
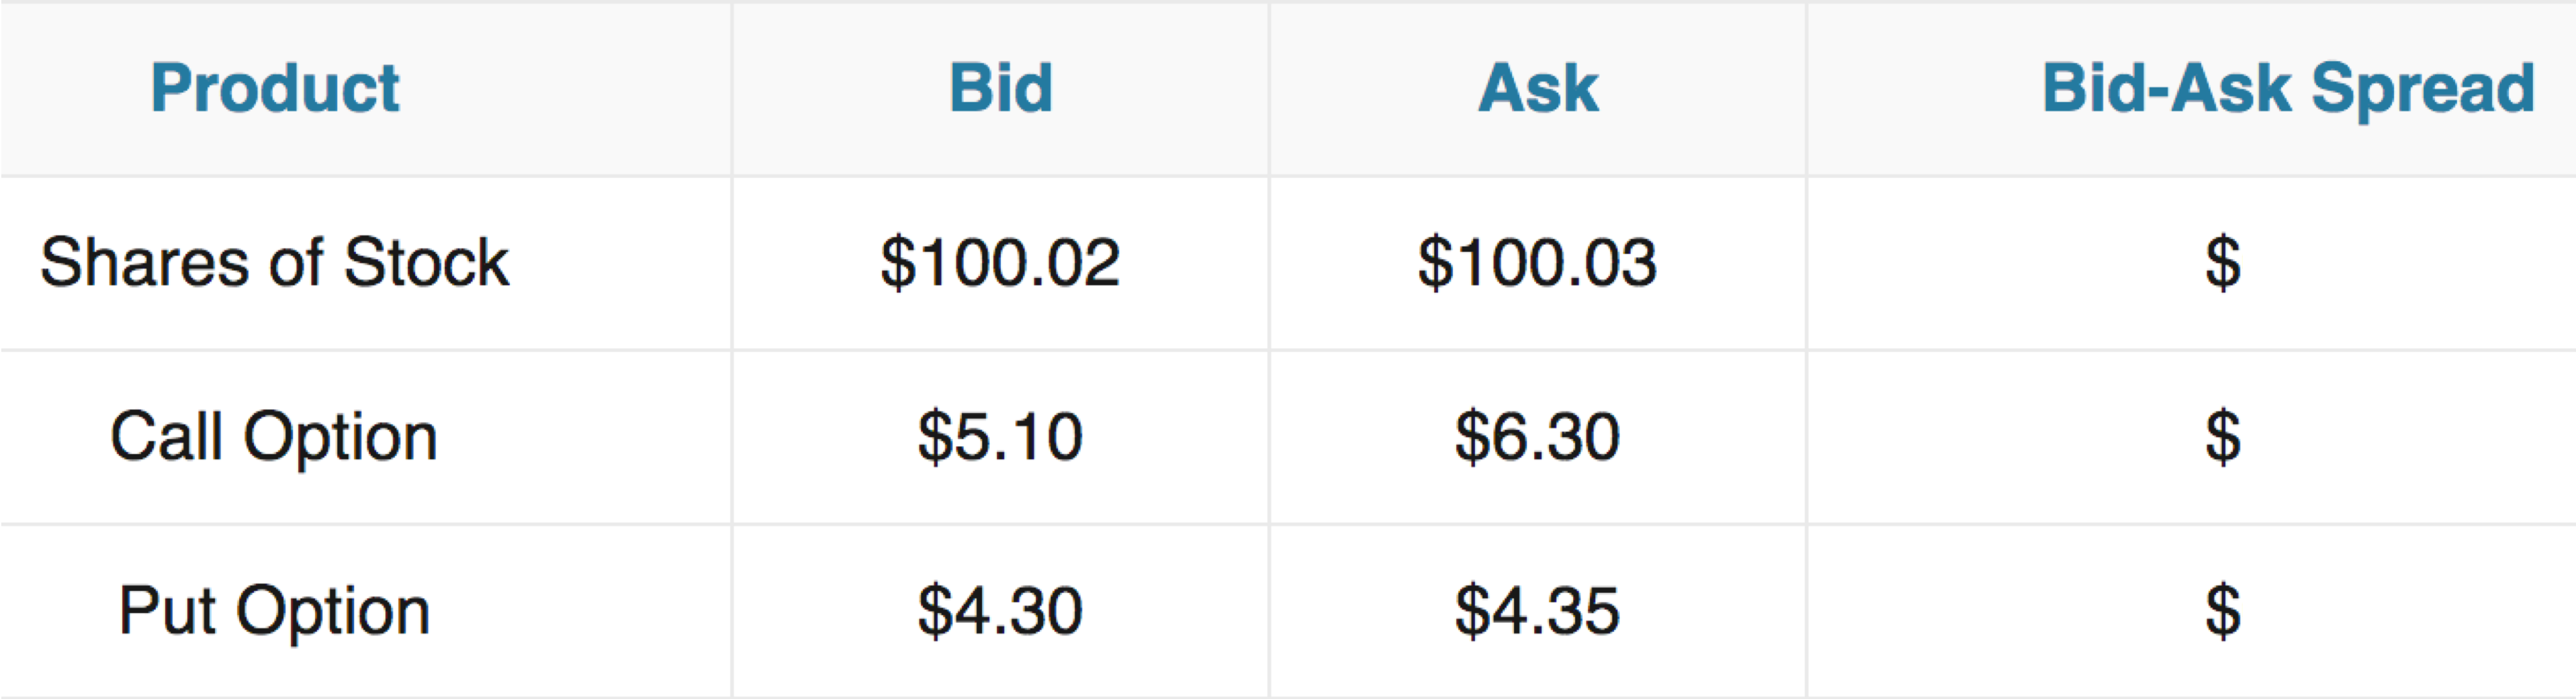
Question 1
Answer
-
0.01
-
1.20
-
0.05
Question 2
Question
[blank_start]Fundamental[blank_end] analysis is a method of evaluating securities by attempting to measure the [blank_start]intrinsic[blank_end] value of a stock. These type of analysts study everything from the overall economy and industry conditions to the financial condition and management of companies. Earnings, expenses, assets and liabilities are all important characteristics to this type of analysis.
Answer
-
Fundamental
-
Supplemental
-
Actual
-
intrinsic
-
extrinsic
-
underlying
Question 3
Question
A [blank_start]stock[blank_end] quote is the price of a stock as quoted on the [blank_start]exchange[blank_end]. Stock [blank_start]quotes[blank_end] update in real-time as the stock is bought and sold through-out a trading session.
Answer
-
stock
-
live
-
exchange
-
paper
-
quotes
-
lists
Question 4
Question
1. [blank_start]Last Price[blank_end]: The most recent price that the stock has traded at. The last price, however, is not the price you will be paying for the stock.
2. [blank_start]Bid[blank_end]: The highest price a buyer is currently willing to pay for a stock.
3. [blank_start]Ask[blank_end]: The lowest price at which a seller is currently willing to sell the stock at. When placing a market order, you are buying or selling a stock at the best available price.
4. [blank_start]Today's Change[blank_end]: The change in price (and the percentage change) compared to yesterday's closing price.
5. [blank_start]Previous Day's Close[blank_end]: This is the price of the stock for the last trade of the previous day.
6. [blank_start]Today's Open[blank_end]: The first price at which this stock traded when the markets opened this morning. Note that stocks do not open at the same price that they closed at the day before due to after hours trading.
7. [blank_start]Volume[blank_end]: This indicates the number of shares that have traded hands today. Some stocks may trade millions of shares each day, and others only trade a few hundred or even zero (the higher the volume, the more liquid the stock is).
8. [blank_start]52 Week High[blank_end]: This is the highest price the stock has traded at during the last 52 weeks.
9. [blank_start]52 Week Low[blank_end]: This is the lowest price the stock has traded at during the last 52 weeks. The 52 week high/low allow you to compare the current price to its 52-week range.
10. [blank_start]Annual Dividends[blank_end]: The amount, in dollars, the company will (but not obligated) pay to shareholders on a regular basis (usually monthly or quarterly).
11. [blank_start]Annual Dividend Yield[blank_end]: This is an important measure of return of the stock and is calculated by dividing the annual dividend amount by the current stock price. If the stock is at $10 and the company pay out a cash dividend of $0.50 per share, then the annual dividend yield is 5%.
12. [blank_start]EPS[blank_end]: Displays the company's earnings (profit) per share. It is calculated by dividing the company's most recent annual income by the number of shares outstanding.
13. [blank_start]Market Cap (aka Market Capitalization)[blank_end]: Is the total dollar market value of all of a company's outstanding shares. Market cap is calculated by multiplying a company's shares outstanding by the current market price of one share. This figure determines the company's relative size.
14. [blank_start]Price-Earnings Ratio (P/E)[blank_end]: Is the ratio for valuing a company and measures its current share price relative to its per-share earnings.
15. [blank_start]Beta[blank_end]: Is used to measure the volatility of a stock as compared to the market as a whole. A beta of 1 means the stock moves up or down more quickly than the market overall; a beta between 0 and 1 means the stock doesn't move as much as the market, and a negative beta means the stock moves in the opposite direction of the market.
Answer
-
Last Price
-
Bid
-
Ask
-
Today's Change
-
Previous Day's Close
-
Today's Open
-
Volume
-
52 Week High
-
52 Week Low
-
Annual Dividends
-
Annual Dividend Yield
-
EPS
-
Market Cap (aka Market Capitalization)
-
Price-Earnings Ratio (P/E)
-
Beta
Question 5
Question
There are 5 standard pivot points.
Answer
- True
- False
Question 6
Question
Support is the price level at which demand is thought to be strong enough to prevent the price from declining further.
Answer
- True
- False
Question 7
Question
Resistance is the price level at which selling is thought to be strong enough to prevent the price from rising further.
Answer
- True
- False
Question 8
Question
Pivot Points are [blank_start]predictive[blank_end] or [blank_start]leading[blank_end] indicators.
Answer
-
predictive
-
supplemental
-
leading
-
trailing
Question 9
Question
[blank_start]Charts[blank_end] are the primary tools for technical analysis.
Answer
-
Charts
Question 10
Question
Support levels can become new resistance levels and vice versa.
Answer
- True
- False
Want to create your own Quizzes for free with GoConqr? Learn more.