1393250
Description
Quiz by mlmallamas, updated more than 1 year ago
|
|
Created by mlmallamas
over 11 years ago
|
|
Question 1
Question
As part of a class project, a college student wanted to estimate the proportion of students at his college that owned a red car. To estimate this proportion he went to a large student parking lot during the middle of a class day. He found that 325 out of 1037 cars (31%) were red. This sample is best described as:
Answer
-
A convenience sample
-
A simple random sample
-
A volunteer response sample
-
A stratified random sample with color of car as the strata
Question 2
Question
A professor wanted to determine the proportion of students in his class who have cheated on an exam. The professor selects a random sample of 30 students from his class and emails them the question "Have you ever cheated on an exam?". He receives responses from 10 of the 30 students. Which of the following statements are true?
Select all that apply.
Answer
-
This study would suffer from undercoverage because the professor should have selected a sample from the entire student body of the university.
-
This study suffers from non-response bias because only 33% of the people surveyed provided a response.
-
This study suffers from response bias since students will not want to tell a professor whether or not they have cheated.
-
The study should not suffer from any bias since it was based on a random sample.
Question 3
Question
Each player in the National Basketball Association is given a jersey number between 0 and 100. The following is a histogram of these NBA jersey numbers.
Answer
-
The median jersey number is between 40 and 60.
-
The mean jersey number is greater than the median jersey number.
-
The median jersey number is greater than the mean jersey number.
-
The median jersey number is less than 20.
-
The mean jersey number and the median jersey number are equal.
-
The third quartile of jersey numbers is 80.
Question 4
Question
A market research company is interested in whether or not households in Franklin County, Ohio have cable television. Using the county auditor's list of households the researcher randomly selected 100 homes and contacted the residents. Of the 100 homes it was found that 62 had cable television.
Which of the following are true?
Select all that apply.
Answer
-
The population of interest is all homes in Franklin County Ohio.
-
The population of interest is the proportion of all homes in Franklin County Ohio that have cable television.
-
The population of interest is the proportion of the 100 homes that have cable television.
-
The population of interest is the county auditors list of households.
-
The parameter of interest is 62%.
-
The parameter of interest is the proportion of all homes in Franklin County Ohio that have cable television.
-
The parameter of interest is the proportion of the 100 homes that have cable television.
-
The parameter of interest is the county auditors list of households.
Question 5
Question
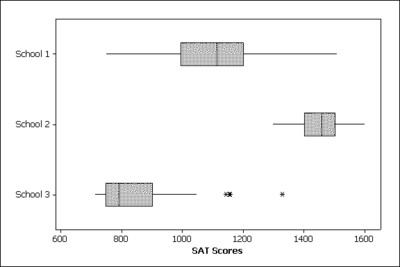
For the SAT college entrance exam (prior to March 2005), the combined scores ranged from 400 to 1600.A study recorded the combined scores from 100 students from each of three schools in a western state.The resulting scores were used to produce these boxplots.
Which of the following are true?
Image:
boxplot_oldfinal (image/png)
Answer
-
School 3 is more skewed right than school 1.
-
School 3 is more symmetric than school 2.
-
The IQR of school 2 is greater than the IQR of school 1.
-
The minimum value of school 2 is greater than the maximum value for school 3.
-
The third quartile of school 3 is greater than the first quartile of school 2.
-
The third quartile of school 2 is greater than 1400.
-
The first quartile of school 2 is greater than 1500.
-
The outliers for school 3 have a greater influence on the median than the mean.
-
The outliers for school 3 have a greater influence on the mean than the median.
-
The outliers for school 3 have a greater influence on the third quartile than the mean.
Question 6
Question
An instructor in a college class recently gave an exam that was worth a total of 100 points. The instructor inadvertently made the exam harder than he had intended. The scores were very symmetric, but the average score for his students was 61 and the standard deviation of the scores was 3 points. The instructor is considering 2 different strategies for rescaling the exam results:
Method 1:Multiply everyone's score by 1.2.
Method 2:Add 9 points to everyone's score.
Which of the following are true?
Select all that apply.
Answer
-
Method 1 will increase the standard deviation of the students' scores
-
Method 1 will decrease the standard deviation of the students' scores.
-
Method 2 will decrease the standard deviation of the students' scores.
-
Method 2 will increase the standard deviation of the students' scores.
Question 7
Question
A college professor stops at McDonald's every morning for 10 days to get a number 1 value meal costing $5.39. On the 11th day he orders a number 8 value meal costing $4.38.
Which of the following are true?
Select all that apply.
Select one or more:
Answer
-
During the first 10 days the professor's standard deviation was more than 0.
-
During the first 10 days the professor's standard deviation was less than 0.
-
During the first 10 days, the professor's standard deviation was 0.
-
It is impossible to tell anything about the professor's standard deviation for the first 10 days.
-
Considering all 11 days, the professor's standard deviation was lower than the standard deviation of the first 10 days.
-
Considering all 11 days, the professor's standard deviation was higher than the standard deviation of the first 10 days.
-
Considering all 11 days, the professor's standard deviation was the same as the standard deviation of the first 10 days.
-
Considering all 11 days, It is impossible to tell anything about the professor's standard deviation compared to the first 10 days.
Question 8
Question
After taking an aptitude test, the computer told Bob that he had a z-score of -1.63.
If scores on the aptitude test are normally distributed, which of the following statements can Bob conclude from his score?
Select all that apply.
Answer
-
Bob score was worse than the mean score.
-
Bob score was better than the mean score.
-
Bob scored within 1 standard deviation of the mean score.
-
Bob scored within 2 standard deviations of the mean score.
-
About 5% of students taking the aptitude test did worse than Bob.
-
About 5% of students taking the aptitude test did better than Bob.
Question 9
Question
The Mental Development Index (MDI) of the Bayley Scales of Infant Development is a standardized measure used in longitudinal follow-up of high-risk infants. The scores on the MDI have approximately a normal distribution with a mean of 100 and standard deviation of 15. What proportion of children have MDI of at least 88?
Answer
-
.2119
-
.7881
-
.1056
-
.8944
Question 10
Question
For a normal distribution, what standard score (Z-score) has 60% of the distribution above it? Find the closest value listed on the table.
Answer
-
-.26
-
-.35
-
-.21
-
.27
Question 11
Question
Which of the following are NOT likely to be well modeled by a normal distribution because the distribution is NOT likely to be symmetric?
Answer
-
The scores from a university’s mathematics placement exam in which the minimum score is 0 and the maximum score is 100. Although there were scores throughout the entire range, more than half of the students scored over 85
-
The number of hours students at a large university work per week at outside jobs. More than 75% of the students worked less than 10 hours but about 5% had jobs in which they worked over 30 hours outside the university.
-
The height (in centimeters) of 10 year old boys in the U.S. Rarely are values lower than 120 cm or over 160 cm and the majority are between 135 cm and 145 cm.
-
The amounts of time people wait at a particular bus stop for the bus. About 60% of the time they wait less than 7 minutes, however, occasionally because of traffic issues they wait as long as 40 minutes.
Question 12
Question
A state administered standardized reading exam is given to eighth grade students. The scores on this exam for all students statewide have a normal distribution with a mean of 509 and a standard deviation of 84. A local Junior High principal has decided to give an award to any student who scores in the top 10% of statewide scores.
Answer
-
617
-
589
-
446
-
673
Question 13
Question
A researcher believes that the ankle circumference for adult females in Europe can be considered to have a normal distribution with a mean of 20 cm.If his belief is correct which of the following ranges of ankle sizes will have the largest proportion of members of this population?
Answer
-
11 to 17 cm
-
17 to 23 cm
-
23 to 29 cm
-
It is impossible to tell without the standard deviation.
Question 14
Question
In a Midwestern state an automobile insurance company has a large number of customers. From company files it is known that 77% of the customers have only the state minimums for insurance. An official with the state board of insurance is going to take a random sample of 100 accounts to review. Find the standard deviation of the sample proportion in this situation.
Answer
-
.0421
-
.2437
-
.0054
-
.6739
Question 15
Question
The registrar of a large university knows that 30% of the students come to college with credit for an advance placement (AP) course. The registrar is going to conduct interviews with students regarding their experiences at the university. Depending on which students are chosen, the proportion of students in the sample that have AP credit may vary.
In a sample of 100 students, what is the probability that over 36% of the sample has AP credit?
Answer
-
.0951
-
.8533
-
.0365
-
.0227
Question 16
Question
The registrar of a large university knows that 30% of the students come to college with credit for an advance placement (AP) course. The registrar is going to conduct interviews with students regarding their experiences at the university. Depending on which students are chosen, the proportion of students in the sample that have AP credit may vary.
In a sample of 200 students, what is the probability that over 31% of the sample has AP credit?
Answer
-
.3783
-
.3520
-
.3491
-
.2572
Question 17
Question
According to a recent report, it was found that 50.3% of residents in Cuyahoga county Ohio are registered to vote. Which of the following is more likely?
Answer
-
We take a random sample of 10 people from this county and find that the proportion is over 55%
-
We take a random sample of 200 people from this county and find that the proportion is over 55%
-
We take a random sample of 500 people from this county and find that the proportion is over 55%
-
We take a random sample of 1000 people from this county and find that the proportion is over 55%
-
We have no basis for predicting which is more likely to have an proportion over 55%
Question 18
Question
At a large university it is known that 40% of the students live on campus. The director of student life is going to take a random sample of 200 students. Which of the following is most likely to occur:
Answer
-
The sample proportion falls between 0.4 and 0.6
-
The sample proportion falls between 0.2 and 0.4
-
The sample proportion falls between 0.3 and 0.5
-
The sample proportion falls between 0.35 and 0.45
Question 19
Question
At North Carolina State University it is known that 56% of undergraduates are male. If a sample of 160 undergraduate students was taken, which of the following would accurately describe the sampling distribution?
Select all that apply.
Answer
-
The sampling distribution will be approximately normal.
-
The sampling distribution will be skewed right.
-
The sampling distribution will be skewed left.
-
The mean of the sampling distribution will be close to 50%
-
The mean of the sampling distribution will be close to 56%
-
We can not determine the mean of the sampling distribution from the given information.
-
The standard deviation of the sampling distribution will be 0.0392.
-
The standard deviation of the sampling distribution will be 0.0015
-
The standard deviation of the sampling distribution will be 0.4964.
Question 20
Question
Which of the following scenarios involving proportions would be appropriate for conducting inference?
Answer
-
A researcher wishes to find the probability that less than 40% of a sample of undergraduate students from UNC will be male. He samples the first 20 students that walk into the gym on Monday morning. The population proportion of undergraduate males at UNC is known to be 41.1%
-
A researcher wishes to find the probability that more than 15.5% of a sample of undergraduate students from Winston Salem State University will be between the ages of 25 and 34. He randomly samples 70 undergraduate students from the student database. The population proportion of undergraduates between the ages of 25 and 34 is 14.9%
-
A grad student at East Carolina wants to know how likely it is that a group of students would be made up of more than 25% graduate students. She will randomly select 45 students and ask them if they are a graduate student or an undergraduate student. The population proportion of grad students and East Carolina is 22.0%.
-
A full time student at UNC Central University wants to know how likely it is that a group of students would be made up of less than 75% full time students. She will ask 40 students that she sees parking in the parking deck if they are full time or part time. The population proportion of full time students at UNC Central is 77%.
Question 21
Question
In engineering and product design, it is important to consider the weights of people so that airplanes or elevators aren't overloaded. Based on data from the National Health Survey, we can assume the weight of adult males in the US has a mean weight of 177 pounds and standard deviation of 32 pounds. We randomly select 50 adult males. What is the probability that the average weight of these 50 adult males is over 175 pounds?
Answer
-
.6700
-
.6532
-
.6318
-
.8701
Question 22
Question
The Mental Development Index (MDI) of the Bayley Scales of Infant Development is a standardized measure used in longitudinal follow-up of high-risk infants. The scores on the MDI have approximately a normal distribution with a mean of 100 and standard deviation of 16. We are going to randomly select 64 children and average their MDI scores. What is the probability that the average is under 101?
Answer
-
.6915
-
.7243
-
.9824
-
.3705
Question 23
Question
A large multinational company knows that the average age of their employees is 34 years. They also know that the standard deviation of the ages of these employees is 8 years. We know that the population of employee ages will have a right skewed distribution. A manager from human resources is going to randomly select a sample of 100. Which of the following is true?
Select all that apply.
Answer
-
We know that the shape of the sampling distribution of the mean will be right skewed.
-
We know that the shape of the sampling distribution of the mean will be approximately symmetric.
-
We can not tell what the shape sampling distribution of the mean will look like.
-
The sampling distribution of the mean will have a smaller standard deviation than the population.
-
The sampling distribution of the mean will have the same standard deviation as the population.
-
The sampling distribution of the mean will have a larger standard deviation than the population.
Question 24
Question
From census data it is known that the average income of households in Wake County is $58,500. It is also known that the distribution of household income in Wake County is strongly skewed to the right with a standard deviation of $14,000. A researcher is going to randomly select a sample of 5 households from Wake County. Which of the following is true?
Select all that apply.
Answer
-
The sampling distribution of the mean will have a smaller standard deviation than the population.
-
We know that the shape of the sampling distribution of the mean will be right skewed.
-
The sampling distribution of the mean will have a larger standard deviation than the population.
-
We can not tell what the shape sampling distribution of the mean will look like.
-
We know that the shape of the sampling distribution of the mean will be approximately symmetric.
-
The sampling distribution of the mean will have the same standard deviation as the population.
Question 25
Question
At a large university it is known that 40% of the students live on campus. The director of student life is going to take a random sample of 200 students. What is the probability that more than half of the sampled students live on campus?
Answer
-
.0019
-
.0046
-
.0032
-
.0095
Question 26
Question
Consider a normal distribution that has a mean of 0.2 and a standard deviation of 0.04.
What value has 1% of this distribution below it? What value has 99% of this distribution below it?
Answer
-
.107, .293
-
.371, .293
-
.524, .783
-
.107, .524
Question 27
Question
A political action committee wanted to estimate the proportion of county residents who support a change to the county leash law. They took a random sample of 600county residents and found that the proportion who wanted to change the law was 33% with a margin of error of +/- 4% (with 95% confidence). This implies:
Answer
-
If we took another sample of 600 residents the sample proportion would definitely be between 29% and 37%.
-
If we take many other samples from this population 95% of them will have a sample proportion that is between 29% and 37%.
-
We can not conclude anything about the population parameter since this is only a sample.
-
We believe that the true proportion of county residents who want the law changed is between 29% and 37%.
-
There is a 95% chance that the true parameter is 33%.
Question 28
Question
The director of human resources at a large corporation takes a random sample of 97 employees. From his sample, he finds that the proportion of their employees that have children is 0.85. What is the standard error of the proportion in this situation?
Answer
-
.036
-
.025
-
.064
-
.082
Question 29
Question
A sample of 900 college freshmen were randomly selected for a national survey. Among the survey participants, 372 students were pursuing liberal arts degrees. The sample proportion is 0.413.
What is the margin of error for a 98% confidence interval for this sample? What is the lower endpoint for the 98% confidence interval?
Answer
-
.038, .375
-
.024, .683
-
.493, 1.36
-
.21, .394
Question 30
Question
In a certain city, there are 1 million homes. As part of an environmental status survey, it was desired to estimate the proportion of homes in this city which contain lead based paints. A simple random sample of 150 households revealed that 49 homes had lead based paints in at least one room. What is the sample proportion?
Answer
-
.327
-
.425
-
.173
-
1.29
Question 31
Question
In which of the following scenarios would it be appropriate to construct a 95% confidence interval for the parameter of interest?
Answer
-
A state safety official wants to estimate the proportion of licensed cars in NC that have worn tires. He randomly selects 5 mechanic shops and he looks at the first 100 car records he finds to see what work was done. He finds that 45% of them have worn tires.
-
A state congressman wants to know the proportion of NC voters who support higher taxes to pay for state parks. He randomly selects 200 voters, and he asks them if they support higher taxes for state parks. 15% of the selected voters supported the higher taxes.
-
A police officer wants to know the proportion of licensed drivers who have had a speeding ticket within the last five years. He randomly selects 30 drivers from a database of all licensed drivers, and checks their records. He finds that 30% of the people had speeding tickets within the last five years.
-
A politician wants to know the proportion of registered women voters that are registered with the Democratic Party. He looks at voter registration, randomly selects 100 women, and sees that 56% of women are registered with the Democratic Party.
Question 32
Question
The t-distribution has more values at the extremes than a standard normal distribution.
Answer
- True
- False
Question 33
Question
The t-distribution is symmetric.
Answer
- True
- False
Question 34
Question
The t-distribution is centered at its degrees of freedom.
Answer
- True
- False
Question 35
Question
The t-distribution is centered at 0.
Answer
- True
- False
Question 36
Question
The t-distribution has fewer values at the extremes than a standard normal distribution
Answer
- True
- False
Question 37
Question
The t-distribution has a skewed distribution
Answer
- True
- False
Question 38
Question
Assume that from the sample of 18 trees the researcher found that the average height was 4.8 meters with a standard deviation of 0.55 meters. Assume that the distribution of the heights of these trees is not strongly skewed and does not have any outliers. For this sample what is the margin of error for her 99% confidence interval?
Answer
-
.376
-
.458
-
.324
-
.683
Question 39
Question
A survey of undergraduates at NCSU asked a random sample of 80 students about the amount they had spent on textbooks (in dollars) during the current term. The 95% confidence interval created from this data was $350 ± $40. This interval indicates:
Answer
-
That the average of all undergraduate students at this university must be $350.
-
The standard deviation of the sample is about 5% smaller than the population standard deviation.
-
That if we take many samples from this population 95% of them will have a sample mean between $310 and $390.
-
The parent population is skewed and thus 5% of the students spent less than $310 or greater than $390 on textbooks.
-
That 95% of all undergraduate students at this university spent between $310 and $390 on textbooks this term.
-
That $40 is 95% of the true average for all undergraduate students.
-
We believe that the average for all NCSU undergraduate students is between $310 and $390.
-
We are 95% confident that the average for the 80 students sampled is between $310 and $390.
-
The average of the 80 students sampled is definitely between $310 and $390.
Question 40
Question
The director of student health at a small high school is studying how many calories students at her high school consume in a day. She takes a random sample of 50 students from the high school and records the number of calories they consume in a 24 hour period. From the sample she found the average number of calories consumed was 1864 and that the standard deviation was 380. However before she finds the confidence interval for how many calories students consume in one day she goes to the statistics teacher for advice. What should the statistics teacher's advice be?
Answer
-
The population may not be normal and the sample size is not large enough. Thus she should not compute the confidence interval.
-
She did not take a simple random sample of the students, thus she should not compute the confidence interval.
-
The standard deviation is not large enough to compute the confidence interval.
-
The population may not be normal, but the sample size is large enough. Thus she can compute the confidence interval.
-
She can calculate the confidence interval but should use a t-distribution since it deals with an average.
Question 41
Question
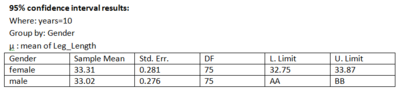
A physiologist was studying the growth of children. As part of this research she was interested in estimating the average length (in centimeters) of the legs of children who were 10 years of age. She took a nationally representative random sample of 10 year old children in the U.S. The resulting data was used to produce the following results.
Image:
Quiz_6.6.PNG (image/PNG)
Answer
-
The missing values for the confidence interval for males (AA and BB) should be 32.98 and 47.92.
-
The missing values for the confidence interval for males (AA and BB) should be 32.47 and 33.57.
-
The missing values for the confidence interval for males (AA and BB) should be 32.99 and 33.05.
-
The missing values for the confidence interval for males (AA and BB) should be 32.74 and 33.30.
-
We believe that 95% of all 10 year old girls would have a leg length between 32.75 and 33.87.
-
We believe the average leg length for all 10 year old girls would be between 32.75 and 33.87.
-
We believe that if you take another sample of this size that there is a 95% chance that average for females will be between 32.75 and 33.87.
Question 42
Question
A regional track championship has decided that they will invite the fastest 15% of runners in their region (runners with the shortest time). The mile time of all potential runners in this region are normally distributed with a mean of 9.5 minutes and a standard deviation of 2.2 minutes. What is the cutoff time for a runner to qualify for the regional track championship?
Answer
-
7.21
-
8.34
-
11.24
-
9.50
Question 43
Question
At a large university it is known that 30% of the students eat at dinning halls on campus. The director of student life is going to take a random sample of 300 students. What is the probability that less than a quarter of the sampled students eat at dinning halls on campus?
Answer
-
.0301
-
.0472
-
.0836
-
.2592
Question 44
Question
Based on data from the National Health Survey, assume the weight of adult females in the US has a mean weight of 142 pounds and standard deviation of 35 pounds. We randomly select 40 adult females. What is the probability that the average weight of these 40 adult females is less than 140 pounds?
Answer
-
.3594
-
.3659
-
.3411
-
.3782
Want to create your own Quizzes for free with GoConqr? Learn more.