9230934
AS Microeconomics -demand and supply
Description
No tags specified
Slide Set by Hannah Nad, updated more than 1 year ago
More
Less
|
|
Created by Hannah Nad
almost 7 years ago
|
|
Resource summary
Slide 1
Understanding demand
Demand
is the quantity of a good or service that consumers are willing and able to buy at a given price in a given time period.
The individual demand and value that we place on good or service is known as utility. Effective demand is when a desire to buy a product is backed up by an ability to pay for it. Derived demand is the demand for a factor of production used to produce another good or service. e.g. steel is linked to the market demand for cards and construction of new buildings. There is an inverse relationship between the price of a good and demand. When there is a high price, there is a low level of demand and vice versa. We use the concept of ceteris paribus when also explaining demand. This is because we only take into account one factor - the price of the good. All other factors are held constant.
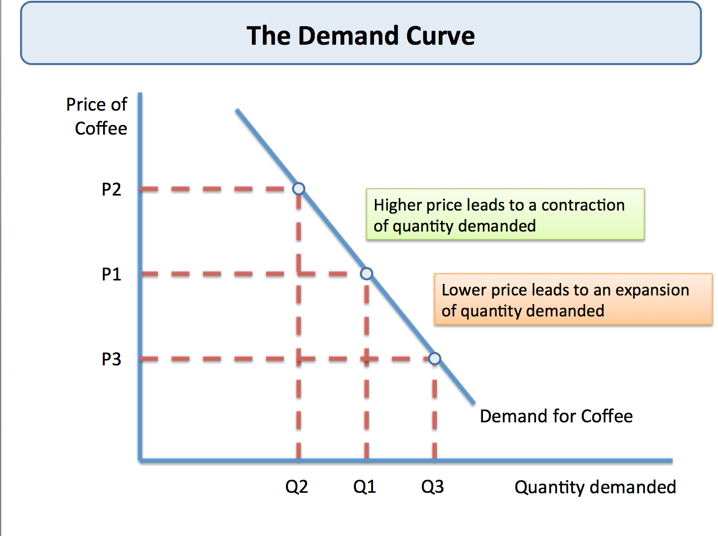
The demand curve shows the relationship between the price of an item and the quantity demanded over a period of time. There are two reasons why more is demanded as price falls.
Income effect - as the price increases of a good, then this takes up a large proportion of income and so the demand decreases.
Substitution effect - when the price of a good falls, consumers are less likely to switch to a substitute.
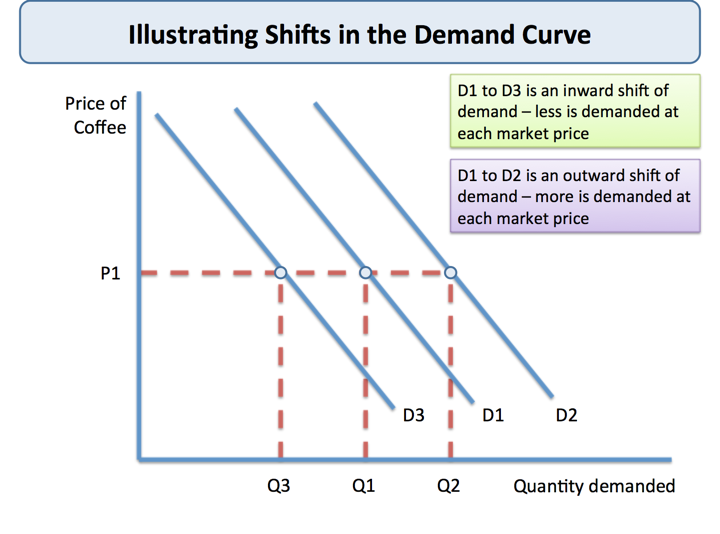
What causes shifts in the demand curve?
Changes in the prices of substitute goods - increase in price of substitute good A then there is an increase in demand for substitute good B because it is cheaper than A. (EV ease of substitution)
Changes in the price of complementary goods - increase in price of complement A means decrease in demand for good B.
Changes in the real income of consumers - if real incomes increase then they can demand more goods and services so demand increases (EV inferior goods, income elasticity)
Effects of marketing and advertising
Interest rates and demand - low IR means cheaper to borrow so demand for borrowing increases.
Slide 2
Diagram analysis
Slide 3
Other factors affecting demand
Utility is a measure of the satisfaction that we get from purchasing and consuming a good or service. Total utility - the total satisfaction from a given level of consumptionMarginal utility - the change in satisfaction from consumption of an extra good or service. As the quantity of goods and services increases, the marginal utility rises and then falls. For example, at 3 units consumed of bread the utility is high but when a larger quantity, say 10 units, of bread is consumed there are adverse effects on the consumer and the utility decreases. Seasonality refers to fluctuations in output and sales related to the season of the year. For example, demand for slippers peaks in the run up until Christmas.
Social and emotional factors also affect demand Social factors include
Social awareness e.g. awareness of health risks of smoking, gambling.
Social norms e.g. decreased demand for recycled bags used in supermarkets.
Social pressures e.g. peer pressure affecting demand for drugs
Emotional factors
Emotion can affect the demand for health insurance after major health incidents.
Binge drinking and eating at times of personal insecurity.
Demand for football tickets imply strong emotional attachment.
Slide 4
Understanding demand
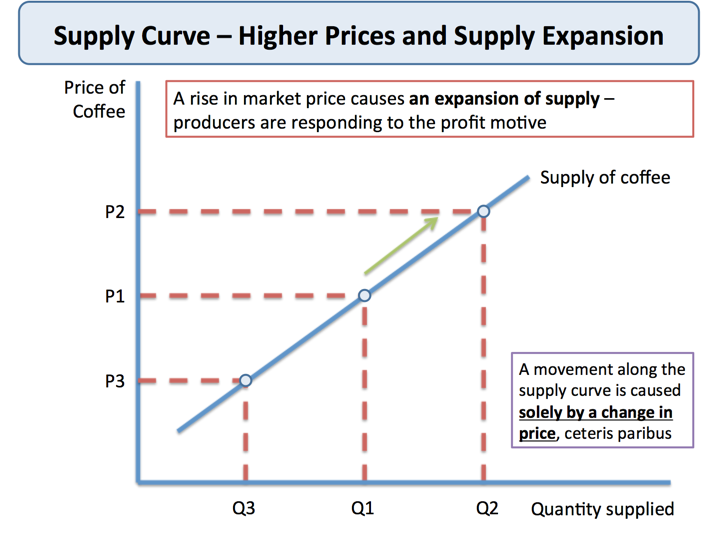
Supply is the quantity of a product that a producer is willing and able to supply onto the market at any given price in a given time period. The law of supply is that as the price of a product rises, businesses are more willing to supply goods and services onto the market. We assume, again, ceteris paribus. All factors remain constant apart from the price. There are three reasons why supply curves are drawn upward sloping
The profit motive - when the market price rises, due to an increase in demand, then businesses believe it is more profitable to enter a market and increase their output.
Production and costs - when output expands, a firm's production costs tend to rise, therefore, a higher price is needed to cover the extra costs of production.
New entrants coming into the market - higher prices may create an incentive for other businesses to enter the market leading to an increase in total supply.
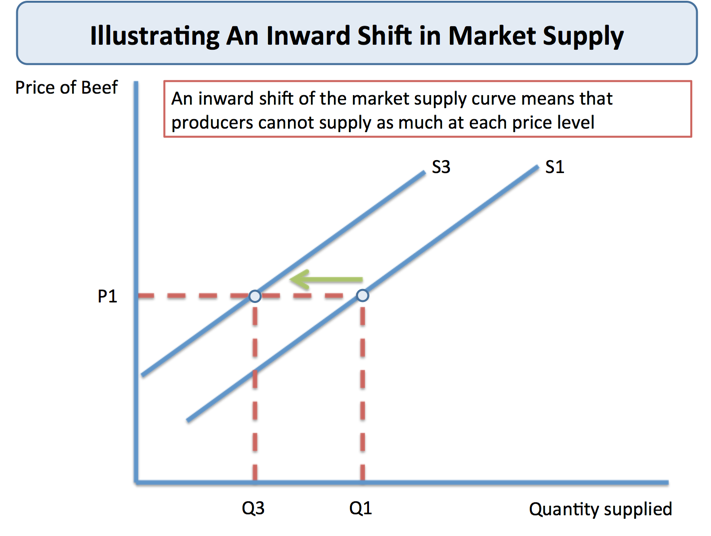
Reasons for a shift in the supply curve
Changes in production costs means that firms can supply more goods at each price. This can be because of an increase in the minimum wage or a depreciation of the exchange rate.
Changes in technology - production technologies innovation can result in increased productivity and result in increases in supply.
Government taxes and subsidies and regulations - indirect taxes cause an increase in costs so decrease in supply, subsidies cause a decrease in costs so an increase in supply, regulations cause a decrease in productivity so an increase in costs so a decrease in supply.
Changes in climate in agricultural industries - for commodities such as wheat, a bad climate conditions can change the supply of a good available to put onto a market.
Changes in the prices of a substitute good - if there is an increase in demand for a substitute good then more people will enter that market and so the supply of that good or service will increase (EV what are the barriers to entry?)
Slide 5
Diagrams for supply
Slide 6
Markets: Finding an equilibrium price
Equilibrium means a state of equality or balance between market demand and supply. This means it is the point where the demand and the supply curve meet. Disequilibrium occurs when there is excess demand or supply in a market. Excess demand is when actual supply is less than demand leading to a market shortage. This is usually caused by low price. Excess supply is when actual supply is greater than demand leading to a market surplus. This is usually caused by overproduction. Changes in equilibrium prices and quantities do not happen immediately. The shifts in the change in demand and supply are reflective of changes within the market.
Slide 7
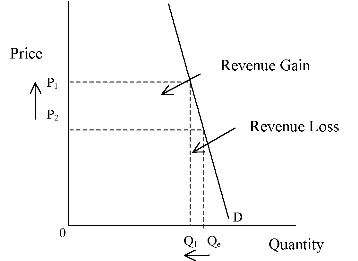
Price elasticity of demand
Price elasticity of demand measures a change in the responsiveness of demand after a change in price. Formula wise this is PED = % change in demand / % change in price
If the PED = 0 then demand is perfectly inelastic. The demand will not change at all when the price is increased or decreased.
If the PED is between 0 and 1 then the demand is inelastic. The demand will only change a little when the price is changed.
If the PED = 1 then demand is perfectly elastic. The demand and price will change by the same proportions.
If the PED > 1 then the demand is elastic. The demand will increase disproportionately to the increase in price.
When demand is inelastic and there is an increase in price then there is likely to be an increase in total revenue and vice versa.When demand is elastic and there is an increase in price then there is likely to be a decrease in total revenue and vice versa.
The factors that affect the price elasticity of demand are
The number of close substitutes - the closer the substitutes the more elastic the PED because consumers find it easy to switch between goods.
The cost of switching between products - there may be costs involved in switching between two substitutes. Demand remains to be inelastic here.
The degree of necessity or whether the good is a luxury - necessities tend to have an inelastic demand where luxuries have an elastic demand.
Proportion of consumer income that the good takes up - products that take up a large % of income are more likely to be elastic in demand.
The time period following a price change - if demand if more price elastic, the longer that consumers have to respond to that change and can search for cheaper substitutes.
Is the good subject to habitual consumption? - consumers become less sensitive to the price of the good if they buy it out of habit.
Peak and off-peak demand - demand can be inelastic at peak times and more elastic during off peak times.
Slide 8
Diagram analysis
Slide 9
Price elasticity of supply
Price elasticity of supply measures the change in the quantity supplied after a change in market price. Formula wise this is % change in quantity supplied / % change in price.If supply is elastic, then producers can increase output without a rise in cost or a time delay. If supply is inelastic, then producers find it hard to increase output within a given time period.
When PES > 1, then supply is price elastic
When PES < 1 then supply is price inelastic
When PES = 1 then supply is perfectly elastic
When PES = 0 then supply is perfectly inelastic
What factors affect the elasticity of supply?
Spare production capacity - if there is plenty of spare capacity then a business can increase output without a rise in costs and so supply is price elastic.
Stocks of a finished product and components - if a firm has the raw materials to produce a good in a given time period then the elasticity of supply is likely to be elastic.
The ease and cost of factor substitution - if labour and capital are both occupationally mobile then the elasticity of supply is likely to be elastic because they can produce more of a good.
The time period and production speed - agricultural products take a long time to produce and can only be produced at certain times of the year. This results in an inelastic PES.
Slide 10
Income elasticity of Demand
Income elasticity of demand measures the relationship between a change in quantity demanded for a good X and a change in real income. Formula wise this is % change in quantity demanded / % change in income.
Normal goods have a positive income elasticity of demand - as consumers incomes rise then the demand for the good or service increases,
Normal necessities have a positive income elasticity of demand between 0 and 1. Demand rises proportionally to income
Luxury goods and services have an income elasticity of greater than 1. Demand rises more than proportionally to a change in income.
Inferior goods have a negative income elasticity of demand meaning that as demand falls income rises and vice versa. e.g. demand for supermarket own-label food.
Slide 11
Cross Price Elasticity of Demand
Cped measures the change in demand for a good X after the change in the price of a good Y.Substitutes have a positive Cped because as the price of good Y increases the demand for good X increases as consumers switch from good Y to good X. Complements have a negative Cped because as the price of goof Y increases, the demand for good X decreases because consumers need good X to buy good Y. Both goods have had a decrease in demand. Unrelated goods have a zero cross elasticity of demand.
Slide 12
Functions of the Price Mechanism
Adam Smith said that all goods and services should be allocated through the price mechanism. This is the hidden-hand of the market operating in a competitive market through the pursuit of self-interest to allocate resources in society's best interest. The price mechanism has three important main functions.
The signaling function - prices adjust to show where resources are required. Prices rise to reflect scarcities of the market when there is excess demand. If there is excess supply then there is a price fall.
Transmission of preferences - through their purchases of goods and services, consumers send information to producers. Higher prices are an incentive to increase output.
Rationing function - prices serve to ration scarce resources when demand outstrips supply. When there is a shortage, due to excess demand, there is an increase in price. This leaves only those who can afford to pay, and are willing to pay, to buy the good.
Slide 13
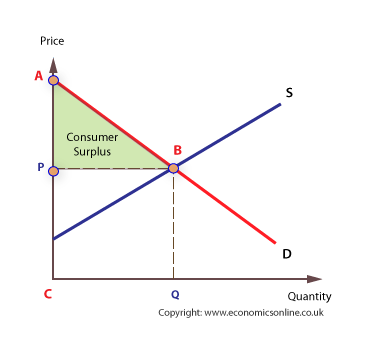
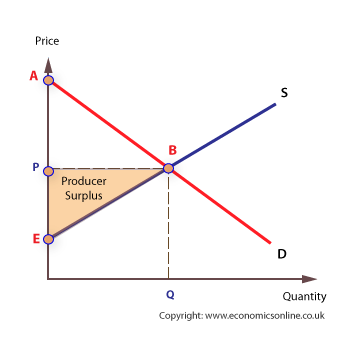
Consumer surplus
Caption: : Consumer surplus is the difference between the price that consumers are willing to pay for a good and service in comparison to what they actually pay.
Caption: : Producer surplus is the difference between that the price that producers are willing to supply a good on the market for in comparison to what they actually pay.
Want to create your own Slides for free with GoConqr? Learn more.