
Modul 3 von 14 · Text
Basics of Bar Graphs
Basics of Bar Graphs
Hello, class! Today we will the tackling the topic of bar graphs. Now, we are not going to be focusing on the other graphs [until future, more advanced courses] because bar graphs are the main chart or graph type in the APDD Community. We will be learning the basics of bar graphs and the information they can and cannot show. Let's get into it!
[Note: Please take notes as you will need them for future bar graph homework, and the upcoming exam!]
Bar graphs use horizontal or vertical rectangles to measure data. The rectangle [also known as the 'bar'] goes up to the point where it gets to the appropriate level. The bars make comparisons to eachother, making the data easy to read. Something that I would not recommend for bar graphs is showing 'trends', line graphs are more suited to that form of data.
Examples of Bar Charts
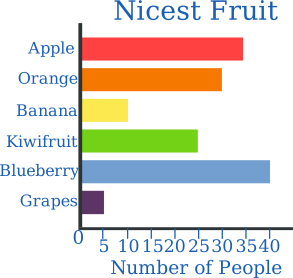
Horizontal Bar Graph: https://www.mathsisfun.com/data/images/bar-graph-horiz.svg
Vertical Bar Graph: http://getwordwall.com/Attachments/Screenshots/Play/bar-graph.png
