
Karteikarten
Section 3 - Demand and Supply
Karten in diesem Stapel (39)
- 1marketa ‘situation’ where buyers and sellers communicate for the purpose of exchanging goods and services.
- 2market 2Market can also refer to the elements of a market: buyer, seller, goods and services and price
- 3market forcesthe forces of demand and supply and the conditions which affect it.
- 4demandthe desire and willingness to buy a product, backed by the ability to pay for it.
- 5supplythe provision of a good or service by producers for sale in the market at a particular price.
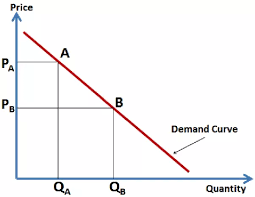
- 6the first law of demandThe first law of demand states that as the price of a good or service is lowered, consumer demand increases.
- 7demand schedulea table showing various quantity demanded at various prices
- 8demand curvea graph showing various quantity demanded at various prices
- 9movement along demand curveextension - When the price of the good decreases, there is a rise in the quantity demanded of the good
contraction - When the price of a good increases, there is a fall in the quantity demanded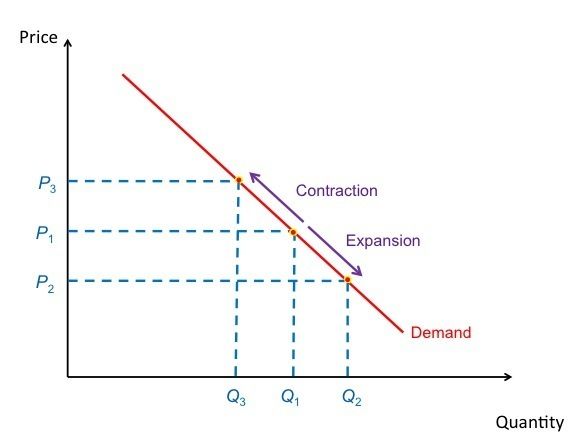
- 10supply curvea graph showing the quantity supplied at various prices. it slopes positively from left to right since a supplier will generally be willing to supply a product at a higher price to earn more profits.
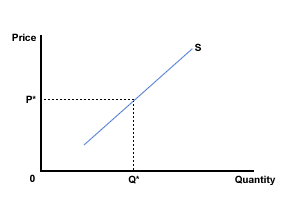
- 11the first law of supplyThe first law of supply is that a greater quantity will be supplied at a higher price.
- 12ceteris paribusCeteris paribus is the Latin phrase meaning ‘other things remaining constant’
- 13market equilibriumMarket equilibrium is the point at which buyers and sellers agree at a price and quantity for the market.
equilibrium point
equilibrium price $30
equilibrium quantity 125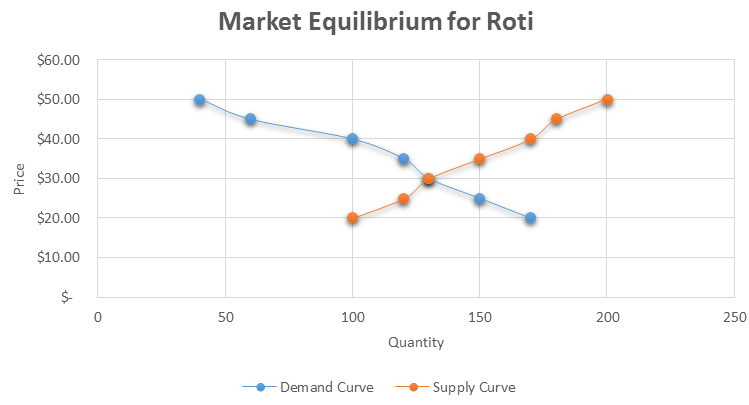
- 14equilibrium quantityconsumer and supplier quantities are equal. No surplus, no shortage. (The 3rd Law);
- 15equilibrium pointthe point where the demand and supply curves intersect;
- 16equilibrium priceprice where quantity demanded is equal to the quantity supplied
- 17disequilibriumMarket disequilibrium results if the market is not in equilibrium. More specifically, market disequilibrium results if the demand price is not equal to the supply price and the quantity demanded is not equal to the quantity supplied. Dis -equilibirum will result in a shortage or surplus.
- 18surplusWhen market price is above the equilibrium price, quantity supplied is greater than quantity demanded. surplus = Q2 - Q1
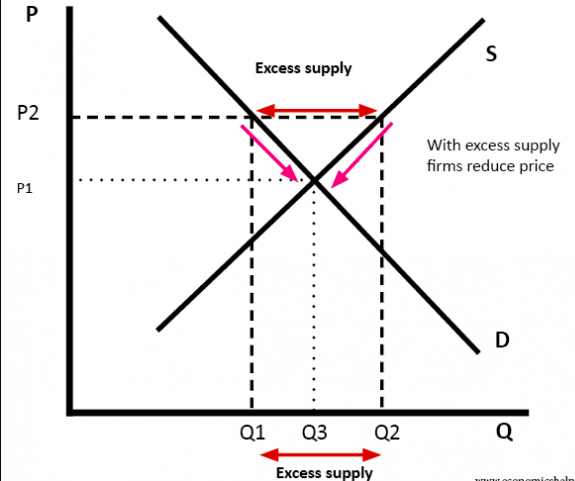
- 19shortageIf the price is below equilibrium then quantity demanded by consumers would be more than the quantity supplied.
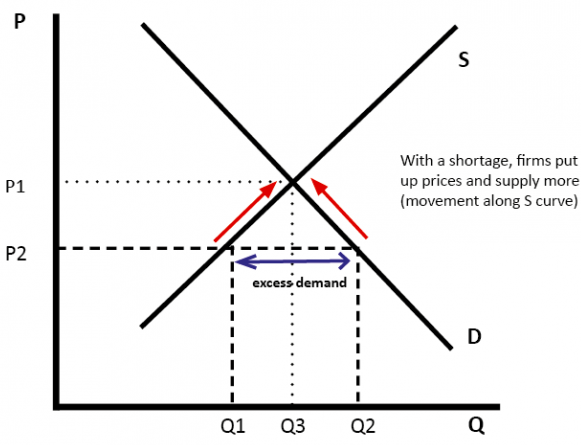
- 20the impact of disequilibriumthe market is self-correcting meaning that if the prices are set above or below the equilibrium price, it will eventually return to its correct equilibrium.
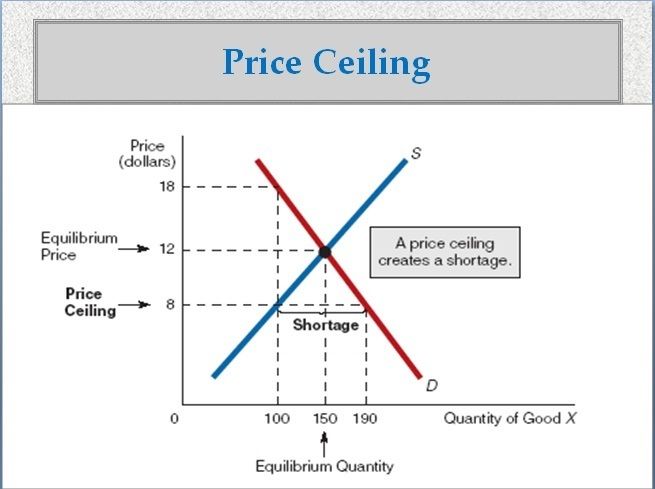
- 21—when the government adjust the price below the market equilibrium. this will result in shortages.
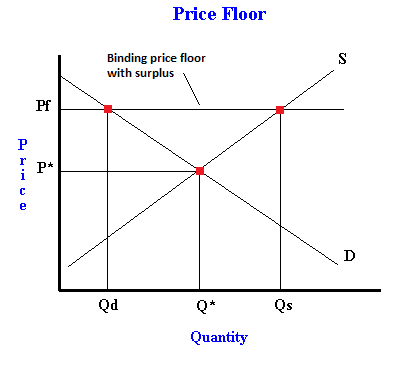
- 22—When prices are set above the equilibrium price. This creates a surplus.
- 23conditions or determinants of demandnon-price factors which will lead to a change of demand (NOT a change in quantity demanded). This will cause shifts of the demand curve to the right (increase) or to the left (decrease)
- 24types of determinants of demand1. Changes in income
2. The price of substitutes and complementary goods
3. Changes in population size
4. Seasonal factors.
5. Increased Advertising and promotion
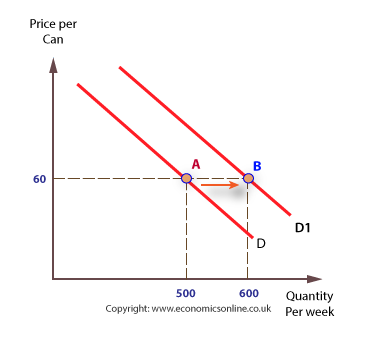
6. Tastes and fashions - 25Increase in demand
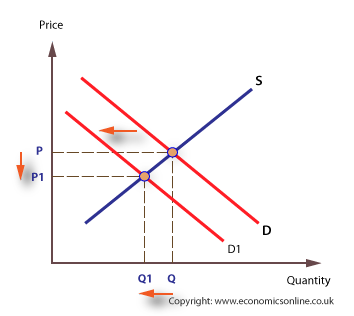
- 26decrease in demand
- 27determinants of supplynon-price factors which will lead to a change of supply (NOT a change in quantity supplied).
an increase in supply is a rightward shift; a decrease in supply is a leftward shift - 28types of determinants of supply1. Changes to the cost of production
2. The number of firms in the industry
3. Weather (forces of nature)
4. Technology
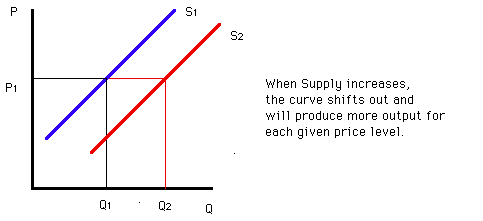
5. Taxes and subsidies - 29supply increase
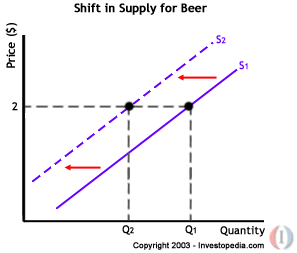
- 30supply decrease
- 31equilibrium changes: demand increase
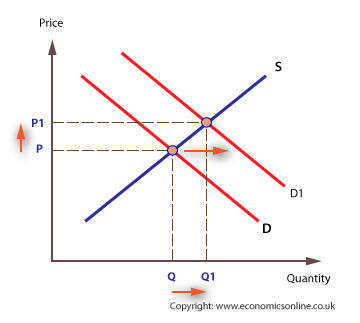
- 32equilibrium changes: Demand increase (description)an increase in demand will shift the demand curve to the right resulting in a higher equilibrium price and a higher equilibrium quantity
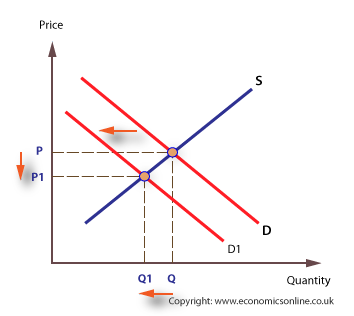
- 33equilibrium changes: demand decrease
- 34equilibrium changes: supply increase (diagram)
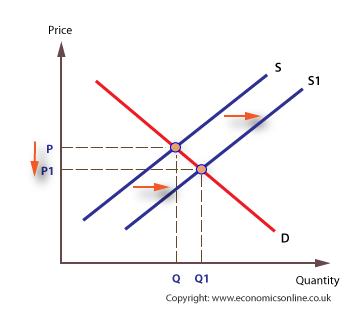
- 35equilibrium changes: supply increase (description)a increase in supply will shift the supply curve to the right resulting in a lower equilibrium price and an increase in equilibrium quantity
- 36equilibrium changes: supply decrease (diagram)
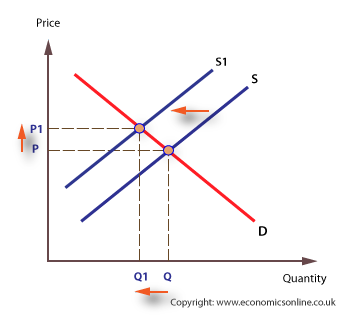
- 37equilibrium changes: supply decrease (description)a decrease in supply will shift the supply curve to the left resulting in a higher equilibrium price and a lower equilibrium quantity
- 38equilibrium changes: demand decrease (description)a decrease in demand will shift the demand curve to the left resulting in a lower equilibrium price and a lower equilibrium quantity
- 39—