
Karteikarten
sdfdsfs
Karten in diesem Stapel (60)
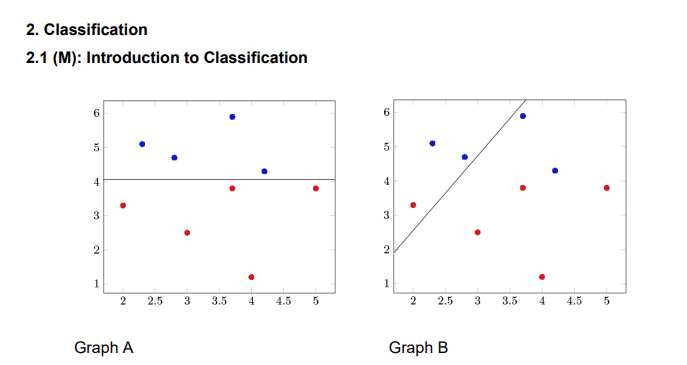
- 1Which graph shows a classifier that separates between the blue and red points?Graph A
All the blue points are above the line and all the red points are below the lin - 2In Graph A, which color would your classifier predict for a point in the lower right-hand corner of the graph?Red
Below only red - 3Which factor is mort important for classification? A. Factor on the horizontal axis B. Factor on the vertical axis C. BothB.
almost all that matters is what is below or above the specific value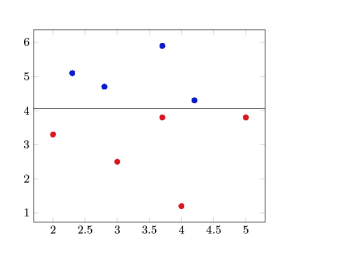
- 4Which graph requires a soft classifier, because no hard linear classifier exists for it? A. A B. B C. CGraph C
its impossible to draw line separating blue + red - 5A survey of 25 people recorded each person’s family size and type of car. 1. Which of these is a data point? A. The 14th person’s family size and car type B. The 14th person’s family size C. The car type of each personAnswer: A. A data point is all the information about one observation
- 62. Which of these is structured data? A. The contents of a person’s Twitter feed B. The amount of money in a person’s bank accountAnswer: B. Every entry will be a number of dollars and cents
- 73. Which of these is time series data? A. The average cost of a house in the United States every year since 1820 B. The height of each professional basketball player in the NBA at the start of the seasonAnswer: A. The same thing is measured at yearly time intervals
- 8: Support Vector Machines (SVM) Which of these two terms measures the error in classifying all of the data points? A. ∑i=1m(ai)2 B. ∑j=1nmax{0,1−(∑i=1maixij+a0)yj}Answer: B. This term measures classification error
- 9: Advanced SVM Look at the classification error expression below. For which set of data points (1-20 or 21-50) is it more important to avoid classification errors? ∑j=1205×max{0,1−(∑i=1maixij+a0)yj} +∑j=2150200×max{0,1−(∑i=1maixij+a0)yj} A. 1-20 B. 21-50Answer: B. The multiplier for classification errors is 200 for data points 21-50, much more than
5 for data points 1-20 - 10Which set of data is scaled between 0 and 1? A. {5, 12, 27, 29} B. {0.0, 0.2, 0.6, 1.0} C. {0.3, 0.4, 0.7, 0.75}Answer: B. The values range from 0 to 1
- 11—Answer: B. The three closest points to the green one are two reds and one blue. There are
more reds than blues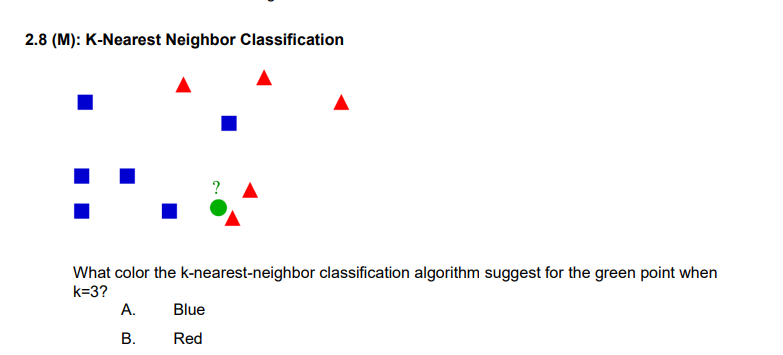
- 12Introduction to Validation If we use the same data to fit a model as we do to estimate how good it is, what is likely to happen? A. The model will appear to be better than it really is. B. The model will appear to be worse than it really is. C. The model will appear to be just as good as it really is.A. The model will be fit to both real and random patterns in the data. The model’s
effectiveness on this data set will include both types of patterns, but its true effectiveness on
other data sets (with different random patterns) will only include the real patterns - 13When comparing models, if we use the same data to pick the best model as we do to estimate how good the best one is, what is likely to happen? A. The model will appear to be better than it really is. B. The model will appear to be worse than it really is. C. The model will appear to be just as good as it really isAnswer: A. The model with the highest measured performance is likely to be both good and
lucky in its fit to random patterns. - 14Splitting Data Which should we use most of the data for: training, validation, or test? A. Training B. Validation C. TestAnswer: A. Most experts recommend using 50-70% of the data for training, and splitting the
rest equally between validation and tes - 15: Cross-Validation 1. In k-fold cross-validation, how many times is each part of the data used for training, and for validation? A. k times for training, and k times for validation B. 1 time for training, and k-1 times for validation C. k-1 times for training, and 1 time for validationAnswer: C. Each of the k times the model is fit, a different part of the data is used for
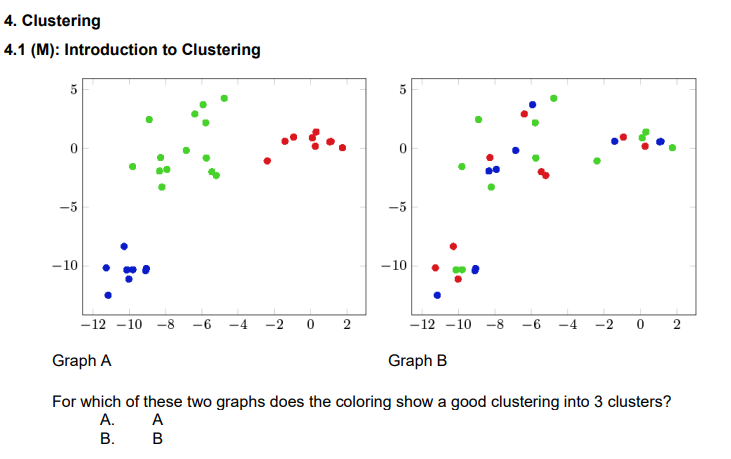
validation and the rest is used for training. - 16—Answer: A. Each color’s nodes are grouped close to each other.
- 17—Answer: B. The power and root are the same as the norm.
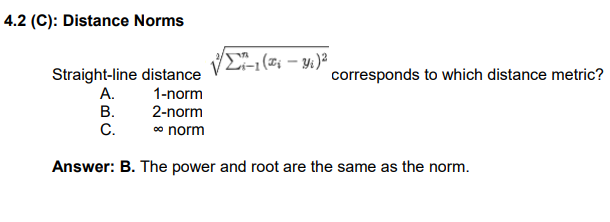
- 184.3 (M): K-means Clustering The k-means algorithm for clustering is a “heuristic” because… A. …it runs quickly. B. …it never gets the best answer. C. …it isn’t guaranteed to get the best answer.Answer: C. Heuristic algorithms are not guaranteed to find the best answer.
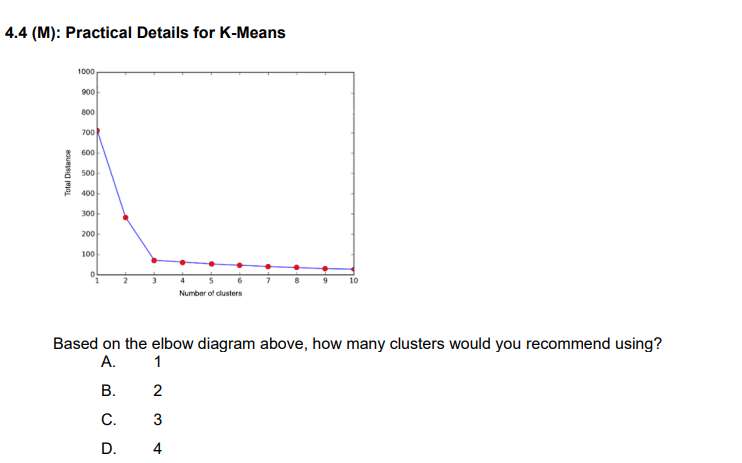
- 19—Answer: C. Cluster 3 makes a significant improvement, but additional clusters do not.
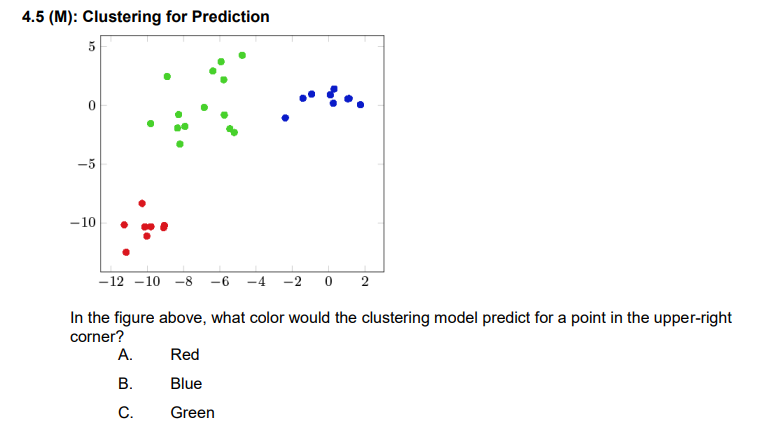
- 20—Answer: B. The blue points are closest to the new poin
- 21: Supervised vs Unsupervised Learning 1. A group of astronomers has a set of long-exposure CCD images of various distant objects. They do not know yet which types of object each one is, and would like your help using analytics to determine which ones look similar. Which is more appropriate: classification or clustering? A. Classification B. ClusteringAnswer: B. Without knowing what each image is, the best you can do is group the images into
ones that are similar (unsupervised learning). - 222. Suppose one astronomer has categorized hundreds of the images by hand, and now wants your help using analytics to automatically determine which category each new image belongs to. Which is more appropriate: classification or clustering? A. Classification B. ClusteringAnswer: A. Because you know the correct classification for hundreds of images, you can build
a model to classify the rest (supervised learning). - 23Which of these is generally a good reason to remove an outlier from your data set? A. The outlier is a incorrectly-entered data, not real data. B. Outliers like this only happen occasionally.Answer: A. If the data point isn’t a true one, you should remove it from your data set.
- 24Why are hypothesis tests often not sufficient for change detection? A. They don’t really detect changes. B. They often are slow to detect changes.Answer: B. Hypothesis tests generally have high threshold levels, which makes them slow to
detect changes. - 25(M): CUSUM for Change Detection In the CUSUM model, having a higher threshold T makes it… A. …detect changes faster, and less likely to falsely detect changes. B. …detect changes faster, and more likely to falsely detect changes. C. …detect changes slower, and less likely to falsely detect changes. D. …detect changes slower, and more likely to falsely detect changes.Answer: C. A higher threshold makes it slower to detect both true and false changes.
- 26Change-Detection Homework Follow-up Analytics professionals are trusted to report the true findings of their models and analyses. A. True B. FalseAnswer: A. So, it’s important to always be honest about results.
- 27Time Series Models 7.1 (M): Introduction to Exponential Smoothing In the exponential smoothing equation St=αxt+(1−α)St−1 a value of closer to 1 is chosen if… A. There’s less randomness, so we’re more willing to trust the observation xt B. There’s more randomness, so we’re more willing to trust the previous estimate St−1Answer: A. We put more weight on the observation xt than the previous estimate St−1
- 28Trends and Cyclic Effects A multiplicative seasonality, like in the Holt-Winters method, means that the seasonal effect is… A. The same regardless of the baseline value. B. Proportional to the baseline value.Answer: B. A multiplicative seasonality is larger when the baseline value is larger, because its
effect is a multiple of the baseline - 29Exponential Smoothing: What The Name Means In the exponential smoothing equation St=αxt+(1−α)St−1 only the current observation xt is considered in calculating the estimate St. A. True B. FalseAnswer: B. Plugging in for St−1, and then for St−2, etc., shows
that St=αxt+(1−α)αxt−1+(1−α)2αxt−2+(1−α)3αxt−3+... - 30Forecasting Is exponential smoothing better for short-term forecasting or long-term forecasting? A. Short-term B. Long-termAnswer: A. Exponential smoothing bases its forecast primarily on the most-recent data points.
For forecasts of the longer-term future, there aren’t data points close to the time being
forecasted - 31(M): ARIMA What does autoregression mean? A. The regression is done automatically B. Previous values of the thing being estimated are used to calculate the estimate C. The regression model is about carsAnswer: B. Its own previous values are used in the estimate
- 32GARCH Why is GARCH different from ARIMA and exponential smoothing? A. GARCH uses time series data B. GARCH is autoregressive C. GARCH estimates varianceAnswer: C. ARIMA and exponential smoothing both estimate the value of an attribute;
GARCH estimates the variance - 338. Basic Regression 8.1 (M): Introduction to Regression When would regression be used instead of a time series model? A. When there are other factors or predictors that affect the response B. When only previous values of the response affect its current valueAnswer: A. Regression helps show the relationships between factors and a response
- 34(C): Maximum Likelihood and Information Criteria If two models are approximately equally good, measures like AIC and BIC will favor the simpler model. Simpler models are often better because… A. Simple models are easier to explain and “sell” to managers and executives B. The effects observed in simple models are easier for everyone, including analytics professionals, to understand C. Simple models are less likely to be over-fit to random effects D. All of the aboveAnswer: D. Simpler models are less likely to be over-fit, easier to understand, and easier to
explain - 35Which of the following is not a common use of regression? A. Descriptive analytics: Understanding how the values of attributes relate to the value of a response. B. Predictive analytics: Predicting the value of a response given the values of attributes. C. Prescriptive analytics: Determining the best course of actionAnswer: C. Regression is often good for describing and predicting, but is not as helpful for
suggesting a course of action - 36Causation vs Correlation Regression is a way to determine whether one thing causes another. A. True B. FalseAnswer: B. Regression can show relationships between observations, but it doesn’t show
whether one thing causes another - 37Transformation and Interactions Suppose our regression model to estimate how tall a 2-year-old will be as an adult has the following coefficients: 0.56xFatherHeight + 0.51xMotherHeight – 0.02xFatherHeightxMotherHeight The negative sign on the coefficient of FatherHeightxMotherHeight means: A. People with two taller-than-average parents won’t be as tall as the individual effects of father’s height and mother’s height add up to B. People with two taller-than-average parents will be taller than the sum of the individual effects of father’s height and mother’s heightAnswer: A. The negative coefficient for the interaction term brings down the overall estimate
- 38Regression Output True or false: A model with an R2 value lower than 0.8 is useless. A. True B. FalseAnswer: B. Most real-life systems have so much uncertainty and so many factors that such
high R2 values are very rare, and there’s often significant value in understanding even 20-30%
of the variability - 399.1 (C): Box-Cox Transformation What does “heteroscedasticity” mean? A. The variance is different in different ranges of the data B. The variances of two samples of data are different from each other C. I don’t knowAnswer: A. Correct! And it’s not even such a hard word to say compared to
‘pneumonoultramicroscopicsilicovolcanoconiosis’! - 409.2 (C): De-Trending You might want to de-trend data before… A. …using time-series data in a triple exponential smoothing (Holt-Winters) model B. …using time-series data in a regression model C. …using non-time-series data in a regression modelAnswer: B. Factor-based models like regression generally don’t account for time-based
effects like trend. - 41Introduction to Principal Component Analysis Which of the following does principal component analysis (PCA) do? A. Transform data so there’s no correlation between dimensions. B. Rank the new dimensions in likely order of importance. C. Both of the above choices.Answer: C. PCA can be a useful tool.
- 42If you use principal component analysis (PCA) to transform your data and then you run a regression model on it, how can you interpret the regression coefficients in terms of the original attributes? A. The first coefficient corresponds to the first attribute in your original data set, the second coefficient corresponds to the second attribute, etc. B. Each original attribute’s implied regression coefficient is equal to a linear combination of the principal components’ regression coefficients. C. You can’t.Answer: B. This is equivalent to using the inverse transformation.
- 43(M): Introduction to CART 1. True or false: In a regression tree, every leaf of the tree has a different regression model that might use different attributes, have different coefficients, etc. A. True B. FalseAnswer: A. Each leaf’s individual model is tailored to the subset of data points that follow all of
the branches leading to the leaf. - 442. True or false: Tree-based approaches can be used for other models besides regression. A. True B. FalseAnswer: A. For example, a classification tree might have a different SVM or KNN model at
each leaf. It might even use SVM at some leaves and KNN at others (though that’s probably
rare). - 45A common rule of thumb is to stop branching if a leaf would contain less than 5% of the data points. Why not keep branching and allow models to find very close fits to each very small subset of data? A. Actually, that sounds like a great idea – we should keep branching and let models find very close fits to very small subsets of data! B. Fitting to very small subsets of data will cause overfitting. C. Fitting to very small subsets of data will make the tree have too many leavesAnswer: B. With too few data points, the models will fit to random patterns as well as real
ones - 46M): Random Forests True or False: When using a random forest model, it’s easy to interpret how its results are determined. A. True B. FalseAnswer: B. Unlike a model like regression where we can show the result as a simple linear
combination of each attribute times its regression coefficient, in a random forest model there
are so many different trees used simultaneously that it’s difficult to interpret exactly how any
factor or factors affect the result. - 47M): Logistic Regression A logistic regression model can be especially useful when the response… A. …is a probability (a number between zero and one). B. …is binary (either zero or one). C. …can take any value. D. Both of the first two answersAnswer: D. Logistic regressions can be useful for either situation.
- 48(C): Confusion Matrices A model is built to determine whether data points belong to a category or not. A “true negative” result is: A. A data point that is in the category, but the model incorrectly says it isn’t. B. A data point that is not in the category, but the model incorrectly says it is. C. A data point that is in the category, and the model correctly says it is. D. A data point that is not in the category, and the model correctly says so. E. A “Debbie Downer” (someone who often says negative things that bring down everyone’s mood).Answer: D. True’ and ‘false’ refer to whether the model is correct or not, and ‘positive’ and
‘negative’ refer to whether the model says the point is in the category - 49Situationally-Driven Comparison The most useful classification models are the ones that correctly classify the highest fraction of data points. A. True B. FalseAnswer: B. Sometimes the cost of a false positive is so high that it’s worth accepting more
false negatives, or vice versa. - 50—(CORRECT ANSWER: ????. The classifier is a vertical line, so all that matters is whether x1 is larger or
smaller than 3.5.)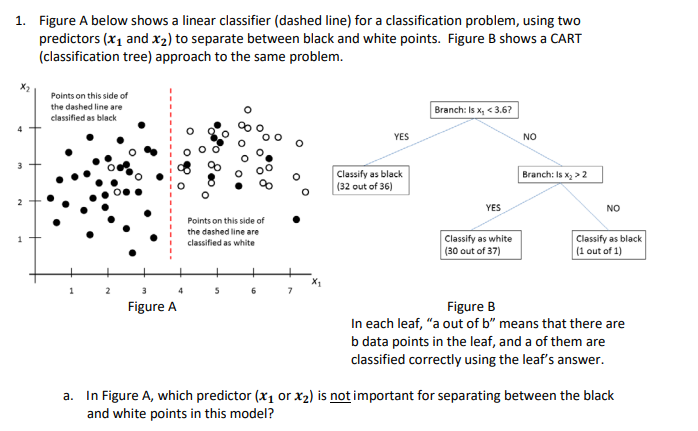
- 51. In Figure B, both ???? and ???? are used to classify the points (even though one was unimportant in Figure A). Which classification model do you think is better (Figure A or Figure B), and why? CHOICES i. Figure A, because Figure B overfits the lower-rightmost leaf. ii. Figure B, because it misclassifies 11 points, and Figure A misclassifies 12 points. i. Figure B, because it uses both predictors for classification. ii. Figure A, because it is a simpler model.(CORRECT ANSWER: i. The lower-rightmost leaf has just one data point in it, a clear example of
overfitting. Although ii is a true answer, it is not correct: B is not a better model even though it
misclassifies one fewer point, because the apparent better fit is due to overfitting. iv might be a
reasonable answer in general, but in this case the overfitting of B overrides having or not having a
slightly simpler model.
NOTE: As we saw in the lessons, as a rule of thumb each leaf should have at least 5% of the
data points, and a common rule of thumb for a factor-based model is to have at least 10 times
as many data points as factors selected.) - 52A geologist would like to build a model to predict the probability that a volcano will erupt in a given week. The geologist has previous eruption data, as well as several factors that can be used as predictors. a. Which of the following models would be most appropriate for the geologist to use to predict the probability of an eruption? CHOICES a. ARIMA g. k-means clustering b. CART h. k-nearest-neighbor classification c. Cross-validation i. Linear regression d. CUSUM j. Logistic regression e. Exponential smoothing k. Support vector machine f. GARCH(CORRECT ANSWER: j. Logistic regression is the model we’ve seen (or will see before the quiz) for
predicting probabilities from a set of factors.) - 53b. Select all of the following models that would be appropriate for the geologist to use to classify data points into “eruption” or “not eruption”. CHOICES a. ARIMA b. CART c. CUSUM d. k-nearest-neighbor e. Support vector machine(CORRECT ANSWERS: b,d,e (all three must be selected for full credit). All three of these are
methods we’ve seen (or will see before the quiz) for classifying based on a set of factors.) - 54b. The geologist used a simple 50% threshold: if the model predicts a probability of 50% or more that the volcano will erupt, the geologist recommends that the nearby towns be evacuated. Do you think 50% is the right threshold, or should it be higher or lower? Explain why.(CORRECT ANSWER: I accepted any answer that made sense. Many people suggested using a
lower threshold, since lives would be at stake: even if the probability of eruption is small, the
towns should be evacuated. Others suggested a higher threshold, also to save lives, because of
the crying-wolf effect: if the towns were evacuated a couple of times and there was no eruption,
people would be less likely to evacuate again, even if the model suggested a higher probability.
And there were other answers I accepted too. Basically, if your answer used analytics reasoning
correctly, you got credit; if it didn’t use analytics reasoning correctly, you didn’t get credit.) - 55Instead of building a model to predict probability, suppose the geologist measures the magnitude of tremors in the area over time. When the magnitude of the tremors changes (gets much larger), the geologist will recommend evacuating nearby towns. Which of the following models would be most appropriate for the geologist to use? CHOICES a. ARIMA g. k-means clustering b. CART h. k-nearest-neighbor classification c. Cross-validation i. Linear regression d. CUSUM j. Logistic regression e. Exponential smoothing k. Support vector machine f. GARCH(CORRECT ANSWER: d. CUSUM is the model we’ve seen for directly detecting changes.)
- 563. A police department has used a k-means approach to find geographic clusters of instances of crime in their city. Their goal is to find locations for new police patrols to reduce crime in high-crime areas. The figures below show the solutions for k=2, k=3, and k=4; circles are crime instances and stars are cluster centers. Based on how far officers can effectively patrol, the police department initially selected the k=4 solution. However, they then realized that some of the crimes were committed during the day and others at night, and they might have two sets of new patrols, one set during the day and set one at night. How would you suggest the police department redo or change its analysis?CORRECT ANSWER: I accepted any answer that made good analytics sense. The most common
one (and the one I was expecting) is that the department could do two clusterings: one using only
daytime data points and one using only nighttime data points, and create daytime patrols and
nighttime patrols based on those two solutions.)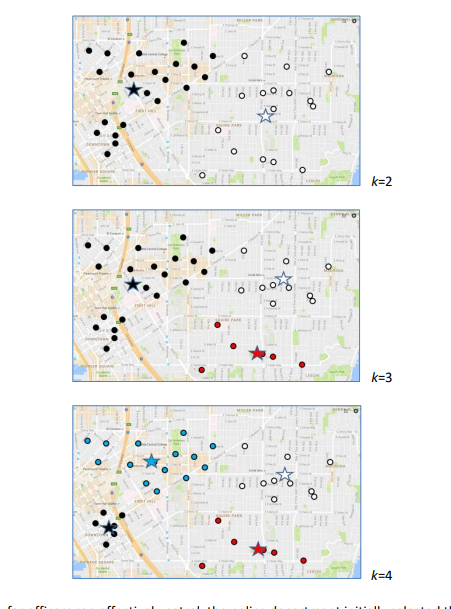
- 57—(CORRECT ANSWERS:
a. v. ?? is the observed value of the response, the hours of operation before the first
breakdown.
b. i. ? is the length of the cycle. Since the question specifies “a vehicle’s sequence
number in its batch”, the cycle length is the 170 vehicles in each batch.)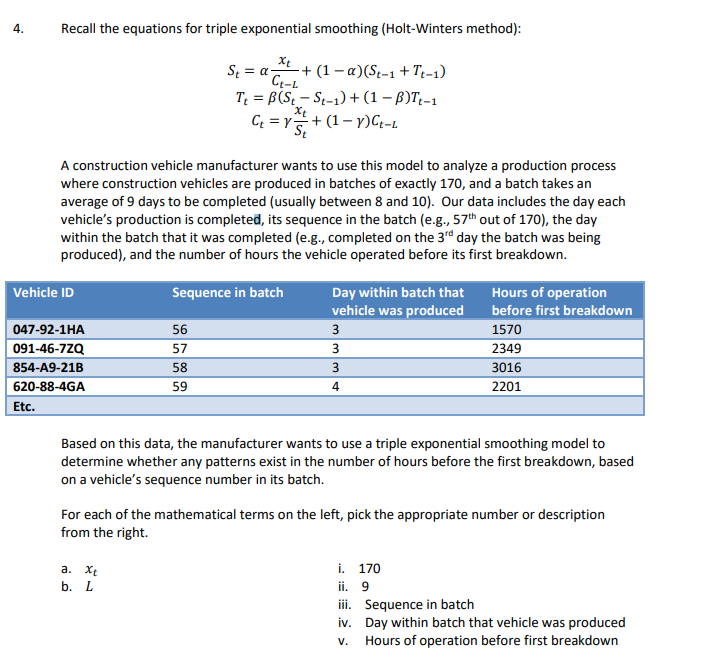
- 58If the manufacturer observes that the values of ?? are generally close to 1, except that they are significantly lower than 1 for vehicles built near the beginning of batches, what can be concluded? i. There is no effect of sequence in batch on the number of hours before the first breakdown. ii. Vehicles built early in a batch tend to break down more quickly. iii. Vehicles built early in a batch tend to break down more quickly, because workers are adjusting to the different specifications in each new batch. iv. Vehicles built early in a batch tend to take longer to break down. v. Vehicles built early in a batch tend to take longer to break down, because workers are paying closer attention to their work early in each new batch.(CORRECT ANSWER: ii. Values of ? less than 1 mean that the response (hours before first
breakdown) is lower, so those vehicles tend to break down sooner. However, all this model
can do is make the observation; there’s nothing in it to explain why the effect is observed – so
although iii. might sound like it makes sense, the model does not say anything about
causality.) - 59d. If the values of ?? tend to be slightly positive, what can be concluded? CHOICES i. Vehicles built more recently tend to take longer to break down. ii. Vehicles built more recently tend to break down more quickly(CORRECT ANSWER: i. Positive values of ?? mean that the response is getting higher over time,
so newer vehicles’ responses (time until first breakdown) tend to be higher. So, vehicles built
more recently tend to take longer to break down for the first time. - 60e. Suppose the manufacturer wanted to use a regression model to answer the same question, using the same data: two predictors (sequence in batch and day within batch) and one response (hours of operation before first breakdown). If the manufacturer first used principal component analysis on the data, what would you expect? HOICES i. The first component would be much more important than the second. ii. The second component would be much more important than the first. iii. The two components would have approximately the same importance.(CORRECT ANSWER: i. With 170 vehicles produced in 8-10 days, the two predictors (sequence
in batch, and day within batch) will be highly correlated. So, the second component will have
much less importance, because its effect will only be whatever is uncorrelated with the first
component. Consequently, in the PCA results the first eigenvalue will be much larger than the
second.)
Informationen
- Beschreibung
- Karteikarten am sdfdsfs, erstellt von Thomas Locker am 28/09/2022.
- Erstellt von
- Thomas Locker
- Aufrufe
- 2
- Bewertung