
Karteikarten
Machine Learning

Karten in diesem Stapel (37)
- 1What is Principal Component Analysis (PCA)?PCA is a dimensionality reduction technique that transforms high-dimensional data into a lower-dimensional form while preserving as much variance as possible. It identifies the principal components, which are the directions of maximum variance in the data, and projects the data onto these components.
- 2What are the main steps in performing PCA?-Standardize the data.
-Compute the covariance matrix of the data.
-Calculate the eigenvalues and eigenvectors of the covariance matrix.
-Sort the eigenvectors by descending eigenvalues to select the principal components.
-Project the data onto the selected principal components. - 3How do you interpret the eigenvalues in PCA?The eigenvalues represent the amount of variance captured by each principal component. Larger eigenvalues indicate components that capture more variance in the data.
- 4What is Linear Discriminant Analysis (LDA)?LDA is a classification technique that finds a linear combination of features that best separates two or more classes of data. It projects the data onto a lower-dimensional space with good class-separability.
- 5How does LDA differ from PCA?PCA is an unsupervised technique that focuses on variance and reduces dimensionality without considering class labels, while LDA is a supervised technique that aims to maximize class separability by considering class labels.
- 6What are the main steps in performing LDA?-Compute the within-class and between-class scatter matrices.
-Compute the eigenvalues and eigenvectors of the matrix formed by the inverse of the within-class scatter matrix multiplied by the between-class scatter matrix.
-Select the top eigenvectors to form the transformation matrix.
-Project the data onto the new lower-dimensional space using this transformation matrix. - 7What is a Multivariate Gaussian (MVG)?An MVG distribution is a generalization of the one-dimensional normal distribution to multiple dimensions, characterized by a mean vector and a covariance matrix.
- 8What is the probability density function of a Multivariate Gaussian distribution?
- 9What does the covariance matrix represent in an MVG?The covariance matrix represents the extent to which pairs of variables in the multivariate data vary together. Diagonal elements represent variances of individual variables, while off-diagonal elements represent covariances between pairs of variables.
- 10What is Logistic Regression?Logistic Regression is a classification algorithm used to predict the probability of a binary outcome. It models the relationship between the input features and the probability of the outcome using a logistic function.
- 11What is the logistic function?The logistic function (sigmoid function) is defined as:
σ(z) = 1/(1+e^z)
where
𝑧
z is the linear combination of input features. - 12How is the model trained in Logistic Regression?The model is trained using maximum likelihood estimation (MLE) to find the parameters that maximize the likelihood of the observed data. This is often done using optimization techniques like gradient descent.
- 13What is a Support Vector Machine (SVM)?SVM is a supervised learning algorithm used for classification and regression tasks. It finds the hyperplane that best separates the data into different classes with the maximum margin.
- 14What is the margin in SVM?The margin is the distance between the hyperplane and the nearest data points from each class. SVM aims to maximize this margin to improve the classifier's robustness.
- 15What are support vectors?Support vectors are the data points that lie closest to the hyperplane and are critical in defining the position and orientation of the hyperplane.
- 16What is the kernel trick in SVM?The kernel trick allows SVM to perform classification in higher-dimensional spaces without explicitly transforming the data. It uses kernel functions to compute the dot product in the transformed space.
- 17What is the purpose of using different kernel functions?Different kernel functions can capture various types of relationships and patterns in the data. For example, the RBF kernel can handle non-linear relationships, while the linear kernel is used for linearly separable data.
- 18What is a Gaussian Mixture Model (GMM)?GMM is a probabilistic model that assumes the data is generated from a mixture of several Gaussian distributions with unknown parameters. Each Gaussian component represents a cluster in the data.
- 19What are the parameters of a GMM?The parameters of a GMM are the mean vectors, covariance matrices, and mixing coefficients of each Gaussian component.
- 20How is a GMM trained?GMMs are typically trained using the Expectation-Maximization (EM) algorithm, which iteratively updates the parameters to maximize the likelihood of the observed data.
- 21What is the formula for the covariance matrix in PCA?

- 22How do you calculate the principal components in PCA?Principal components are calculated by solving the eigenvalue equation:
Σ𝑣=𝜆𝑣
where Σ is the covariance matrix,
𝑣 is an eigenvector, and
𝜆 is the corresponding eigenvalue. - 23How is the data projected onto the principal components?The data is projected onto the principal components using:
𝑧 = 𝑊^(𝑇) (𝑥−𝜇)
where 𝑊 is the matrix of selected eigenvectors (principal components). - 24What is the formula for the within-class scatter matrix 𝑆w in LDA?

- 25What is the formula for the between-class scatter matrix 𝑆b in LDA?

- 26What is the eigenvalue problem in LDA?The eigenvalue problem in LDA is:
𝑆w^(−1)𝑆b 𝑣 = 𝜆𝑣
where 𝑆w is the within-class scatter matrix,
𝑆b is the between-class scatter matrix,
𝑣 is an eigenvector, and
𝜆 is the corresponding eigenvalue. - 27What is the formula for the Multivariate Gaussian (MVG) probability density function (pdf)?

- 28How is the mean vector 𝜇 calculated in MVG?

- 29How is the covariance matrix Σ calculated in MVG?

- 30What is the formula for the logistic (sigmoid) function in Logistic Regression?The logistic function 𝜎(𝑧) is:
σ(z) = 1/(1+e^z)
where 𝑧 is the linear combination of input features
𝑧 = W^(T) 𝑥 + 𝑏 - 31What is the cost function used in Logistic Regression?

- 32How is the gradient of the cost function with respect to 𝑤 calculated?

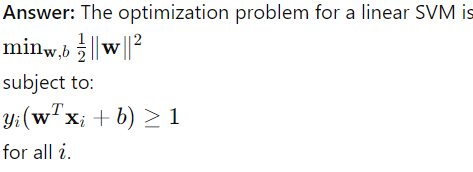
- 33What is the optimization problem for a linear SVM?
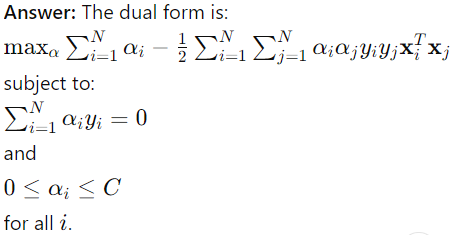
- 34What is the dual form of the SVM optimization problem?
- 35What is the decision function in an SVM?The decision function is:
𝑓(𝑥) = W(T) 𝑥 + 𝑏
where 𝑤 and 𝑏 are the parameters found during training. - 36What is the formula for the Radial Basis Function (RBF) kernel?

- 37What is the formula for the likelihood of a data point in a GMM?

Informationen
- Beschreibung
- Karteikarten am Machine Learning, erstellt von Salvo Cabras am 03/06/2024.
- Erstellt von
- Salvo Cabras
- Aufrufe
- 7
- Tags
- Bewertung