
Mindmap
Unit two
Inhalt der Mindmap
Unit two
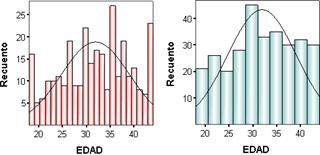
Histograms
- To determine the spread or variation of a set of data points
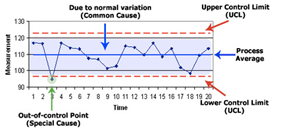
Control Charts
- One of the goal on using a control chad is to achieve and maintain process stability
- Why use?
- To monitor process variation
- Common causes
- This variation is expected and predictable
- Why use?
- One of the goal on using a control chad is to achieve and maintain process stability
"P" Charts
- Are used to measure the proportion of items in a sample that are defectives
- Ucl=p+Zσp
- Lcl=p-Zσp
- P
- Sample of proportion defective
- P
- Z
- Number of standard deviations
- σp
- Standar deviation of sample
- σp=√((P(1-p))/n)
- Lcl=p-Zσp
- Ucl=p+Zσp
- Are used to measure the proportion of items in a sample that are defectives
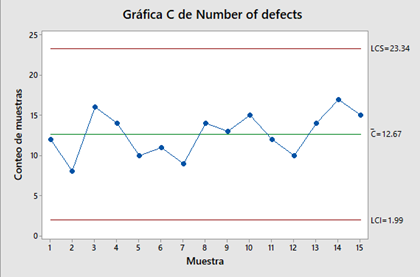
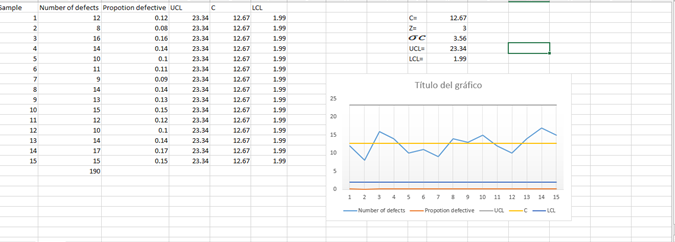
"C" charts
- Are used to monitor the quantity of defects per united
- UCL
- C +Zσc
- LCL
- C-Zσc
- σc
- √c
- UCL
- Are used to monitor the quantity of defects per united
Variable data charts
- Elapsed time
- Temperature
- Radiation dose
“X” BAR AND “R” CHARTS
- x
- Media
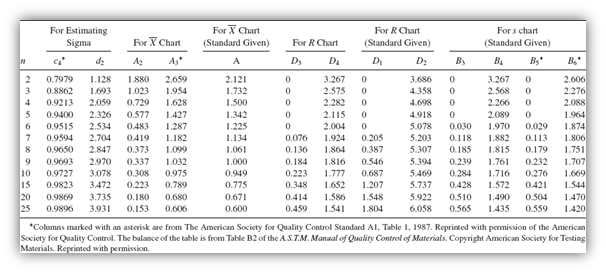
- UCL=D4 R
- LCL=D3*R
- UCL=D4 R
- Media
- R
- Rango
- UCL=X+A2 R
- LCL=X-A2*R
- UCL=X+A2 R
- Rango
- The “X” Bar portion of the chart meanly shows any changes in the mean value of the process, while the “R” portion shows any change in the dispersion of the process.
- x
THE 7 QC STATISTICAL TOOLS
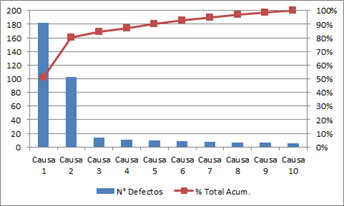
- Pareto charts
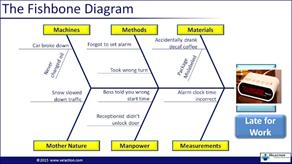
- Cause and effect diagram
- Graphs
- Check sheet
- Histograms
- Scatter diagrams
- Control charts
Fihbone
- components
- Straight line
- Ribs
- Medium size bones
- Small bone
- components
Bilder und Dateien der Mindmap
Informationen
- Beschreibung
- Mindmap am Unit two, erstellt von Alejandra Muñoz am 22/06/2017.
- Erstellt von
- Alejandra Muñoz
- Aufrufe
- 0
- Bewertung