1205315
Statistics
- Basic concepts (for examples)
- Population
- Sample
- Identified variable
- Type of variable
- Data
- Parameter
- Statistics
- Population
- Measurement scales
- Nominal:
Measurement
property.
Descriptive, no
inherent numerical
value. E.g. Gender.
- Ordinal: Identity and
magnitude properties.
Values have unique
valus and an ordered
relation between
them. E.g. Results
from competition.
- Interval: Identity,
magnitude and equal
intervals properties.
Know wether different
values are bigger or
smaller and how much
different they are. E.g.
Fahrenheit
50°-60°=40°-50°
- Ratio: Identity,
magnitude, equal
intervals and minimum
value of 0 properties.
E.g. Weight of an
object. (All properties
together.)
- Nominal:
Measurement
property.
Descriptive, no
inherent numerical
value. E.g. Gender.
- Sampling methods
- Non-probability
- Voluntary:
People
self-select for
the survey.
(Web surveys)
- Convenience:
Made up of
people easy
to reach.
- Quota: A
defined sample
chosen out form
a sub-group by
the surveyer.
- Voluntary:
People
self-select for
the survey.
(Web surveys)
- Probability
- Systematic:
Every possible
sample of n
elements is not
equally likely.
- Cluster: Clusters
are groups
randomly created
where only
individuals within
are survyed.
- Stratified:
Population is
divided in strata
which are the
characteristics the
surveyer looks for.
- Simple
random:With
population N and
sample n, all n
objects are equally
likely to occur.
(Lottery)
- Systematic:
Every possible
sample of n
elements is not
equally likely.
- Non-probability
- Visual displays of data
- Displays:
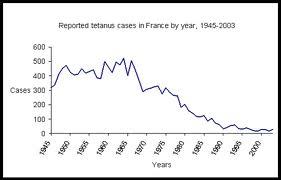
- Line graphs
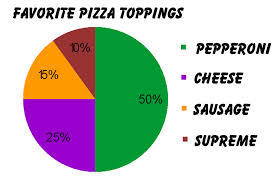
- Circle graphs
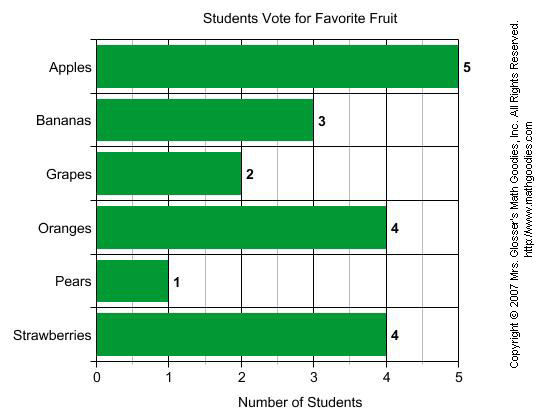
- Bar graphs
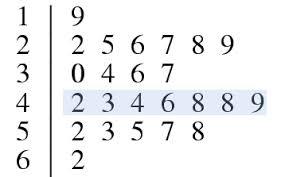
- Stem and leaf
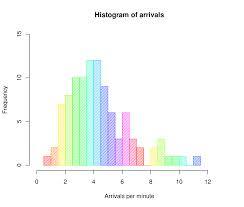
- Histogram
- Line graphs
- Frecuency distribution
- Frequency:
number of times
corresponding
item occurs in
data set.
- Fraction ot
percentage of
the data set
represented
by the item.
- Grouped frequency
distribution: Make each
data item will fit only into
one class; make all
classes the same width;
Make sure classes do
not overlap; use from
5-12 classes.
- Frequency:
number of times
corresponding
item occurs in
data set.
- Displays:
- Measures of central tendency
- Median:
(n+1)/2,
ordered from
least to most.
- Mode:
Value that
occurs
most often
- Mean: sum of
all items
between the
number of
these.
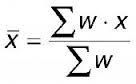
- Wieghted mean
- Median:
(n+1)/2,
ordered from
least to most.
- Measures of dispersions
- Standar deviation
- Range: Greatest value-least value
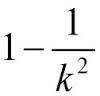
- Chebyshev's theorem
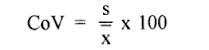
- Coefficient of variation
- Standar deviation
- Measures of position
- Z-score: Standar score
- Decile: D1, D2...D1O
Quartile: Q1, Q2, Q3,
Q4 Percentile: 1% to
100%
- Box plot
- Z-score: Standar score
- Luis David Alcalá Díaz A01400383
Medienanhänge
Möchten Sie kostenlos Ihre eigenen Mindmaps mit GoConqr erstellen? Mehr erfahren.