
Mindmap
Week 2 - Financial Statement Analysis
Inhalt der Mindmap
Week 2 - Financial Statement Analysis
Categories of Ratios
- 1. Profitability Ratio
- Success of managers in a company for generating profit
- ROCE
- Overall profitability OP = profit before tax CE = SHE + NCL
- Operating profit /Capital employed x100
- Gross profit margin
- How well production costs have been controlled to other costs
- Gross profit / Sales x100
- Operating or net profit margin
- Operating profit Sales x100
- EBITDA: Capital employed
- EBITDA / Capital employed x100
- Net asset turnover
- Guide to productive efficiency = how well assets have generated sales
- Sales / Capital employed
- 2. Working capital ratios
- show how efficiently a company has managed short-term assets and liabilities
- Inventory days = Inventory/COS x 365
- This ratio shows how long it takes for a company to turn its stocks into sales. The shorter the stock days ratio, the lower the cost to the company of holding stock.
- Trade receivable days = TR/Sales or Credit sales x 365
- Gives the average period of credit being taken by customers compared to allocated credit period
- Trade payable days = TP/COS or credit purchases x 365
- Gives the average time taken for suppliers of goods and services to receive payment
- Cash conversion cycle = ID + TR - TP
- It indicates time needed for financing working capital. The longer the cash conversion cycle, the higher the investment in working capital.
- 3. Liquidity ratios
- Current ratio = CA/CL
- Ability to meet your financial obligations. Should be normally around 2.
- Quick Ratio = (CA – Inv)/CL
- Wether or not the company can pay off its current liabilities if they were due today!
- Similar to current ratio but excludes inventory. should be normally around 1.
- Current ratio = CA/CL
- 4. Gearing ratios
- How a company is financed with respect to debt and equity and can be used to assess the financial risk that arises with increasing debt
- Capital gearing = Long term debt (NCL)/CE
- Debt/Equity = LTD/SHE
- Higly geared if >100%
- Interest cover = OP/Interest payable
- The interest coverage shows how many times the company can cover its current interest payments, indicates whether servicing the debt may be a problem. IC>7 is usually regarded as safe, while IC>3 is acceptable.
- 5. Investor - earnings ratios
- Price earnings (P/E) ratio
- How much an investor is prepared to pay for a company’s share. Valuing of company in a takeover
- Market price per share / Earnings per share
- Earnings per share (EPS)
- Asses the effect of proposed financing. Key ratio by stock market investors
- Profit attributable to shareholders / Number of ordinary shares
- Investor - Dividends Ratios
- Dividend yield
- How much an investor expects to gain
- Dividend per share / Market price per share x100
- Payout ratio
- Is used to analyse the dividend policy
- Total dividend paid/ Profit attributable to SH x100
- Dividend cover
- Indicates how safe a company’s divindend payment is. The higher, the more likely the company can maintain or increase in future dividends
- Earnings per share / Dividend per share = times
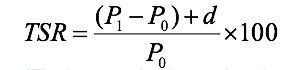
- Total shareholder return
- Measures purely the financial return for shareholders – no relation to the financial statements
- The increase in share price (market price y1 - y2 ) + dividend received / yr 2 = a percentage of the opening share price’
- Dividend yield
- Return on Equity (ROE)
- Profit attributable to shareholders / Shareholders’ equity x 100
- Earnings yield
- Ratio of potential return to shareholders
- Earnings per share (EPS) / Market price per share x 100
- Price earnings (P/E) ratio
- 1. Profitability Ratio
Why ratios?
- A financial ratio is an index that relates two accounting numbers and is obtained by dividing one number by the other.
- Absolute numbers indicates the size of business
- Relative numbers are essential for assessing performance because ratios enable comparison
- problems with ratios analysis
- Imperfect and imprecise
- SOFP - can be taken on 1 day of the year or prepared 3 months earlier - different picture might have different values. EX. missing out dividends or tax payable.
- tends to be performed on historical data
- Not accurate quite to current position or future value.
- reliability of ratios, depend on reliability of accounting information
- Difficult to find similar company for 'intercompany comparison'
- No two companies are same or identical - this needs to take care
- Just the beginning and needs other information to support and explain them
- Imperfect and imprecise
Useful numbers derived from the financial statements
- Capital Employed =
- = Shareholders’ Equity + Non-current Liabilities
- = Non-current Assets + Working Capital
- Working Capital
- Current Assets – Current Liabilities
- EBITDA = Earnings before interest, taxation, depreciation and amortisation
- = Operating Profit + (Dep’n + Amort’n)
- EBITDA is a measure of cash-flow that excludes financing and capital expenditure & indicates trends in profitability
- issues -
- ignores earnings & revenue
- ignores contribution to cash flow made by changes in working capital
- Capital Employed =
Bilder und Dateien der Mindmap
Informationen
- Beschreibung
- Accounting (Corporate Tax) Mindmap am Week 2 - Financial Statement Analysis, erstellt von Manira Rodrigues am 01/03/2018.
- Erstellt von
- Manira Rodrigues
- Aufrufe
- 5
- Bewertung