37909410
Beschreibung
Mindmap von Sharol Juliana Jiménez Montaño, aktualisiert more than 1 year ago
|
|
Erstellt von Sharol Juliana Jiménez Montaño
vor mehr als 3 Jahre
|
|
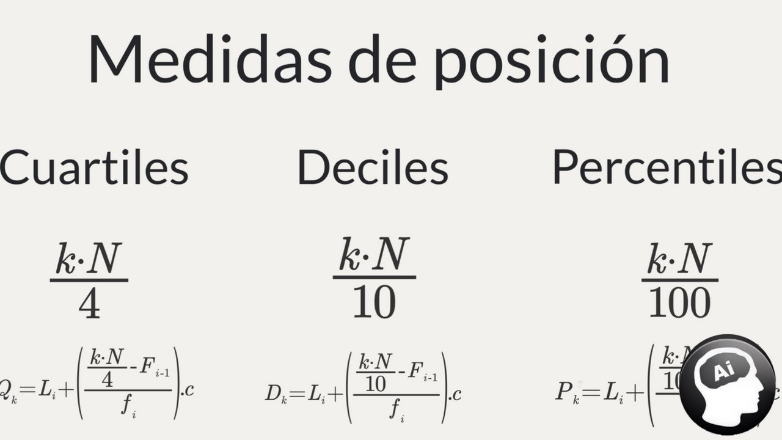
position measurements
- A measure of location is a value that divides a data set into equal percentages used to rank the
observations in a population or sample.
- features
- They allow you to divide a data set into equal percentages and are used to
rank the observations in a population or sample. The most common
measures of position are quartiles, deciles, and percentiles.
- This is a number chosen to indicate the direction
of the data set and is useful for interpreting the
information as a percentage.
- the types of measurements are:
- deciles
- is a measure of position that divides the frequency distribution into
ten equal parts starting from the first to the ninth. Deciles are
denoted by the letter Da
- parameters
- The location parameter has the function of determining the distribution along the line. their values
depend on the presence or absence of phenomena such as Asymmetry, non-normal data, coexistence
of subpopulations Parameters can be more useful
- The main position parameters are:
- Arimetic mean:
- this is the most used position parameter because it summarizes A set of data in a single value that
provides the concept of location its entirety. center of gravity can also be considered distribution to
move asymmetrically Average value; affected by the presence of unusual data, both As the sample size
decreases, more
- Median
- is the value that leaves 50% of the data on each page unseen Affected by the presence of unusual data
(assuming the same size performance). It is a proxy measure of the average, thus achieving Data and
comparisons are useful, especially in them. small sample size.
- are classified
- non-central tendency
- and the central
- non-central tendency
- are classified
- is the value that leaves 50% of the data on each page unseen Affected by the presence of unusual data
(assuming the same size performance). It is a proxy measure of the average, thus achieving Data and
comparisons are useful, especially in them. small sample size.
- Mode
- it is the most repeated value in the distribution. Yes A distribution that pools multiple subgroups, we
can When it comes to multimodal phenomena. Quartiles: leave 25% (C1), 50% (C2, median) and 75%
(C3) on the left side of the distribution.
- it is the most repeated value in the distribution. Yes A distribution that pools multiple subgroups, we
can When it comes to multimodal phenomena. Quartiles: leave 25% (C1), 50% (C2, median) and 75%
(C3) on the left side of the distribution.
- Arimetic mean:
- The main position parameters are:
- The location parameter has the function of determining the distribution along the line. their values
depend on the presence or absence of phenomena such as Asymmetry, non-normal data, coexistence
of subpopulations Parameters can be more useful
- parameters
- is a measure of position that divides the frequency distribution into
ten equal parts starting from the first to the ninth. Deciles are
denoted by the letter Da
- quartiles
- is a location metric that divides the frequency distribution
into four equal modes. denoted by the symbol Qa
- is a location metric that divides the frequency distribution
into four equal modes. denoted by the symbol Qa
- porcentiles
- These measurements are primarily used to determine the
values in a data set that lie in a frequency distribution.
- These measurements are primarily used to determine the
values in a data set that lie in a frequency distribution.
- deciles
- They allow you to divide a data set into equal percentages and are used to
rank the observations in a population or sample. The most common
measures of position are quartiles, deciles, and percentiles.
- features
Medienanhänge
Möchten Sie kostenlos Ihre eigenen Mindmaps mit GoConqr erstellen? Mehr erfahren.