
Mindmap
5 PRESENTATIONS
Inhalt der Mindmap
5 PRESENTATIONS
Deming Cycle (PDCA)
- The Deming Cycle, also known as the PDCA Cycle (Plan-Do-Check-Act) or PDSA (Plan-Do-Study-Act), is an iterative four-step management method used for the control and continuous improvement of processes and products.
- The Four Steps
- Do
- Implement the plan on a small scale (trial or pilot) to test changes
- Implement the plan on a small scale (trial or pilot) to test changes
- Act
- If successful, standardize the change (implement it broadly). If unsuccessful, adjust the plan and repeat the cycle.
- Example
- Plan
- The warehouse noticed shipping delays. Data showed packers spent too much time searching for boxes. The goal was to cut packing time.
- The warehouse noticed shipping delays. Data showed packers spent too much time searching for boxes. The goal was to cut packing time.
- Do
- Tested a standardized packing station layout and box-sizing guide on just one packing line for two weeks.
- Tested a standardized packing station layout and box-sizing guide on just one packing line for two weeks.
- Check
- Measured the results and found packing speed increased by 40% on that test line.
- Measured the results and found packing speed increased by 40% on that test line.
- Act
- Rolled out the new standardized station layout to all packing lines across the entire warehouse.
- Rolled out the new standardized station layout to all packing lines across the entire warehouse.
- Plan
- Example
- If successful, standardize the change (implement it broadly). If unsuccessful, adjust the plan and repeat the cycle.
- Plan
- Identify a goal, analyze the current process, and formulate a plan for improvement.
- Identify a goal, analyze the current process, and formulate a plan for improvement.
- Check
- Measure and analyze the results of the pilot against the expected outcomes.
- Measure and analyze the results of the pilot against the expected outcomes.
- Do
- Key Benefits
- Promotes a culture of continuous improvement (Kaizen) and prevents recurring mistakes through structured problem-solving.
- The Four Steps
- The Deming Cycle, also known as the PDCA Cycle (Plan-Do-Check-Act) or PDSA (Plan-Do-Study-Act), is an iterative four-step management method used for the control and continuous improvement of processes and products.
Poka-Yoke
- Poka-Yoke is a Japanese term that translates to "mistake-proofing" or "error-proofing." It is a technique used to prevent human errors from turning into defects in a process.
- Primary Purpose
- To design processes, equipment, or tools in such a way that an operation is physically impossible to perform incorrectly, or makes errors immediately obvious.
- Key Benefits
- Eliminates reliance on human memory or attention, dramatically reduces defect rates, and lowers waste and rework costs.
- Example
- A microwave that will not turn on if the door is open, or a SIM card shaped with a cut corner so it can only be inserted in the correct orientation.
- A microwave that will not turn on if the door is open, or a SIM card shaped with a cut corner so it can only be inserted in the correct orientation.
- Primary Purpose
- Poka-Yoke is a Japanese term that translates to "mistake-proofing" or "error-proofing." It is a technique used to prevent human errors from turning into defects in a process.
Pareto Chart
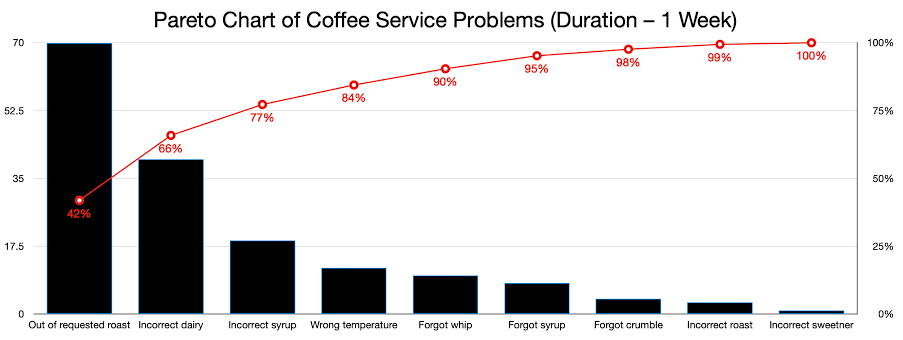
- A Pareto Chart is a type of chart that contains both bars and a line graph, where individual values are represented in descending order by bars, and the cumulative total is represented by the line. It is based on the Pareto Principle (the 80/20 rule), which suggests that roughly 80% of effects come from 20% of the causes.
- Primary Purpose
- To prioritize problems or causes so that teams can focus their resources where they will have the maximum impact.
- Example
- Analyzing customer complaints to discover that 80% of returns are caused by just two specific product defects out of ten possible issues.
- Analyzing customer complaints to discover that 80% of returns are caused by just two specific product defects out of ten possible issues.
- Example
- To prioritize problems or causes so that teams can focus their resources where they will have the maximum impact.
- Key Benefits
- Instantly highlights the "vital few" problems from the "trivial many," ensuring efficient problem-solving and cost reduction
- Primary Purpose
- A Pareto Chart is a type of chart that contains both bars and a line graph, where individual values are represented in descending order by bars, and the cumulative total is represented by the line. It is based on the Pareto Principle (the 80/20 rule), which suggests that roughly 80% of effects come from 20% of the causes.
Quality Circles
- Quality Circles are small groups of employees (usually doing similar work) who voluntarily meet regularly to identify, analyze, and solve work-related problems concerning quality, productivity, safety, or cost.
- Primary Purpose
- To empower frontline workers, leverage their hands-on experience, and foster teamwork and communication across the organization.
- Key Benefits
- Increases employee morale, boosts engagement, and drives practical bottom-up improvements that management might overlook.
- Example
- A group of assembly line workers meeting weekly to brainstorm ways to reduce ergonomic strain and speed up component assembly safely.
- A group of assembly line workers meeting weekly to brainstorm ways to reduce ergonomic strain and speed up component assembly safely.
- Primary Purpose
- Quality Circles are small groups of employees (usually doing similar work) who voluntarily meet regularly to identify, analyze, and solve work-related problems concerning quality, productivity, safety, or cost.
HISTOGRAM
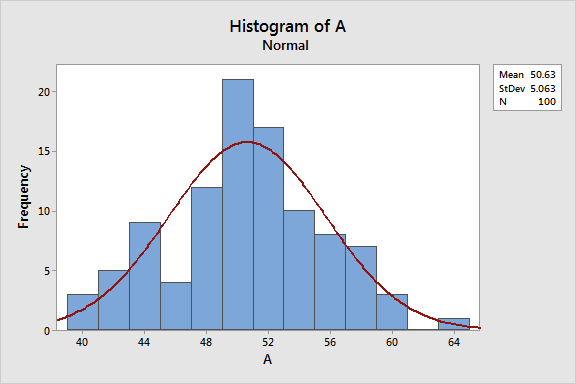
- A histogram is a graphical representation that organizes a group of data points into user-specified ranges (often called "bins" or "classes"). It looks similar to a bar chart, but instead of representing categories, the X-axis represents continuous numerical data.
- Primary Purpose
- To display the frequency distribution of continuous data, allowing teams to see the underlying distribution (e.g., normal, skewed, bimodal) of a process.
- Key Benefits
- Helps identify process variations, spots outliers or anomalies, and compares process performance against specification limits.
- Example
- Measuring the exact weight of packaged cereal boxes to see how consistently the filling machine is performing.
- Measuring the exact weight of packaged cereal boxes to see how consistently the filling machine is performing.
- Primary Purpose
- A histogram is a graphical representation that organizes a group of data points into user-specified ranges (often called "bins" or "classes"). It looks similar to a bar chart, but instead of representing categories, the X-axis represents continuous numerical data.
Bilder und Dateien der Mindmap



Informationen
- Beschreibung
- Mindmap am 5 PRESENTATIONS, erstellt von ERIK DANIEL MORENO LOPEZ am 11/10/2026.
- Erstellt von
- ERIK DANIEL MORENO LOPEZ
- Aufrufe
- 0
- Bewertung