
Mindmap
Business Reporting, Visual Analytics & Dashboard
Inhalt der Mindmap
Business Reporting, Visual Analytics & Dashboard
Principles of Visual Perception
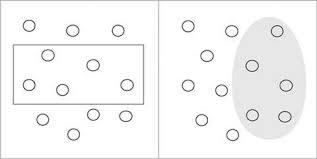
- Enclosure
- Objects enclosed are percieved as belonging together
- Proximity
- Objects close to one another
- Closure
- Open structure perceived as closed, complete or regular when we can reasonably do so
- Continuity
- Objects belonging together if they are aligned with on another
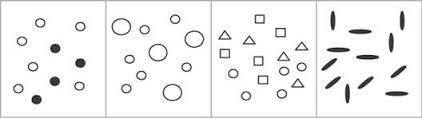
- Similarity
- Group objects similar in
- Shape
- Size
- Colour
- Orientation
- Group objects similar in
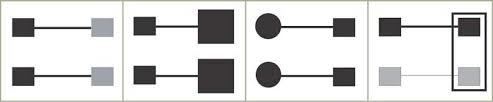
- Connection
- Perception of grouping through connection
- Enclosure
Steps to visual dashboard design
- Enhance data pixels
- Highlight the most important data pixels that remain
- Eliminate all unnecessary data pixels
- Reduce non-data pixels
- Eliminate all unnecessary non-data pixels
- De-emphasize and regularize the non-data pixels that remain
- Enhance data pixels
Types of Business Reports
- Metric Management Reports
- Dashboard-Type Reports
- Strategic Purposes
- High level measures of performance
- Forecasts
- Indicator of performance
- Contxtual information
- High level measures of performance
- Operational
- Constantly changing enivronment
- Grab attention immediately to abnormalies
- Analytical
- Show patterns
- Support intertactions
- Sophisticated display media
- Types of Graphs
- Specialized
- Geographic Map
- Heat map/ Tree Map
- Gantt Chart
- PERT Chart
- Bullet Graph
- Highlight Table
- Histogram
- Basic
- Pie Chart
- Scatter Plot
- Bar Chart
- Line Chart
- Bubble Chart
- Specialized
- Strategic Purposes
- Balanced Scorecard-type reports
Organise information to support its meaning and use
Visual Perception in Pre-attentive processing
- Color
- Calm
- Attention Grabbing
- Position
- Motion
- Form
- Color
Principles for Dashboard Design
- Include only information that is needed
- Condense information
- Display infomation that can be understood easily
- Customize dashboard for audience and objective
Expression of data
- Non-quantitative Dashboard Data
- Top 10 Customers, Schedules,Due Dates,Issues to be investigated
- Enrichment through
- Comparison
- This year vs Last Year
- Evaluation
- Comparison
- Variations in Timing
- Year/Quarter/Month/Week
- Non-quantitative Dashboard Data
Bilder und Dateien der Mindmap



Informationen
- Beschreibung
- Mindmap am Business Reporting, Visual Analytics & Dashboard, erstellt von Tay Qin Han am 05/12/2015.
- Erstellt von
- Tay Qin Han · Dez 2015
- Aktualisiert
- 3 Jun 2016
- Aufrufe
- 6
- Bewertung