
Mindmap
A3: Population Policies (i + ii)
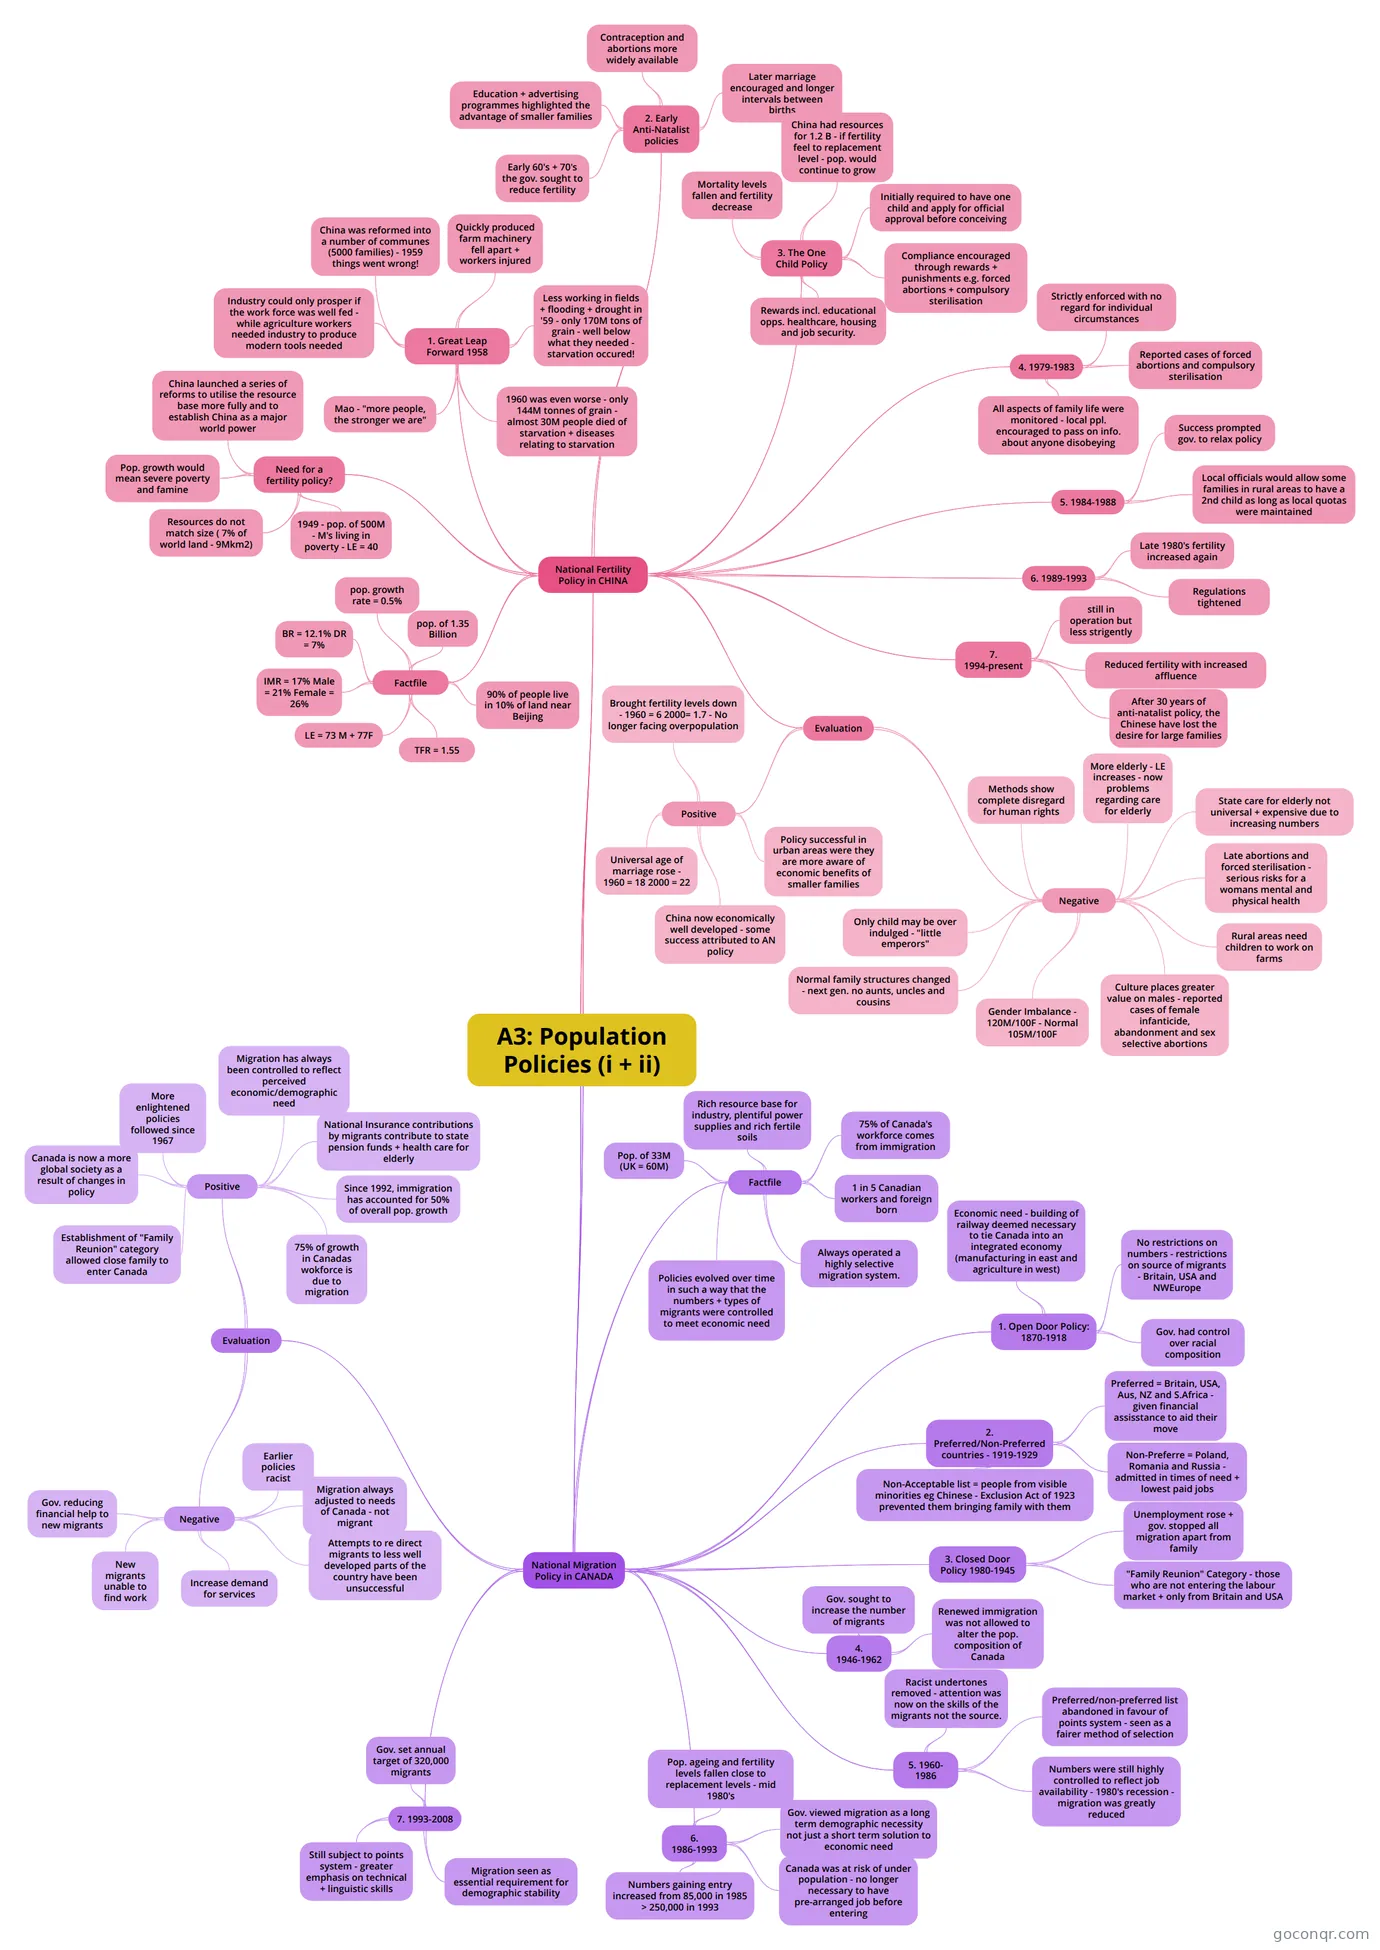
Mind map: A3: Population Policies (i + ii)
Inhalt der Mindmap
A3: Population Policies (i + ii)
National Fertility Policy in CHINA
- Factfile
- pop. of 1.35 Billion
- pop. growth rate = 0.5%
- BR = 12.1% DR = 7%
- IMR = 17% Male = 21% Female = 26%
- LE = 73 M + 77F
- TFR = 1.55
- 90% of people live in 10% of land near Beijing
- Need for a fertility policy?
- 1949 - pop. of 500M - M's living in poverty - LE = 40
- Resources do not match size ( 7% of world land - 9Mkm2)
- Pop. growth would mean severe poverty and famine
- China launched a series of reforms to utilise the resource base more fully and to establish China as a major world power
- 1. Great Leap Forward 1958
- Mao - "more people, the stronger we are"
- Industry could only prosper if the work force was well fed - while agriculture workers needed industry to produce modern tools needed
- China was reformed into a number of communes (5000 families) - 1959 things went wrong!
- Quickly produced farm machinery fell apart + workers injured
- Less working in fields + flooding + drought in '59 - only 170M tons of grain - well below what they needed - starvation occured!
- 1960 was even worse - only 144M tonnes of grain - almost 30M people died of starvation + diseases relating to starvation
- 2. Early Anti-Natalist policies
- Early 60's + 70's the gov. sought to reduce fertility
- Education + advertising programmes highlighted the advantage of smaller families
- Contraception and abortions more widely available
- Later marriage encouraged and longer intervals between births
- 3. The One Child Policy
- Mortality levels fallen and fertility decrease
- China had resources for 1.2 B - if fertility feel to replacement level - pop. would continue to grow
- Initially required to have one child and apply for official approval before conceiving
- Compliance encouraged through rewards + punishments e.g. forced abortions + compulsory sterilisation
- Rewards incl. educational opps. healthcare, housing and job security.
- 4. 1979-1983
- Strictly enforced with no regard for individual circumstances
- Reported cases of forced abortions and compulsory sterilisation
- All aspects of family life were monitored - local ppl. encouraged to pass on info. about anyone disobeying
- 5. 1984-1988
- Success prompted gov. to relax policy
- Local officials would allow some families in rural areas to have a 2nd child as long as local quotas were maintained
- 6. 1989-1993
- Late 1980's fertility increased again
- Regulations tightened
- 7. 1994-present
- still in operation but less strigently
- Reduced fertility with increased affluence
- After 30 years of anti-natalist policy, the Chinese have lost the desire for large families
- Evaluation
- Positive
- Brought fertility levels down - 1960 = 6 2000= 1.7 - No longer facing overpopulation
- Universal age of marriage rose - 1960 = 18 2000 = 22
- China now economically well developed - some success attributed to AN policy
- Policy successful in urban areas were they are more aware of economic benefits of smaller families
- Negative
- Methods show complete disregard for human rights
- More elderly - LE increases - now problems regarding care for elderly
- State care for elderly not universal + expensive due to increasing numbers
- Late abortions and forced sterilisation - serious risks for a womans mental and physical health
- Rural areas need children to work on farms
- Culture places greater value on males - reported cases of female infanticide, abandonment and sex selective abortions
- Gender Imbalance - 120M/100F - Normal 105M/100F
- Normal family structures changed - next gen. no aunts, uncles and cousins
- Only child may be over indulged - "little emperors"
- Positive
- Factfile
National Migration Policy in CANADA
- Factfile
- Pop. of 33M (UK = 60M)
- Rich resource base for industry, plentiful power supplies and rich fertile soils
- 75% of Canada's workforce comes from immigration
- 1 in 5 Canadian workers and foreign born
- Always operated a highly selective migration system.
- Policies evolved over time in such a way that the numbers + types of migrants were controlled to meet economic need
- 1. Open Door Policy: 1870-1918
- Economic need - building of railway deemed necessary to tie Canada into an integrated economy (manufacturing in east and agriculture in west)
- No restrictions on numbers - restrictions on source of migrants - Britain, USA and NWEurope
- Gov. had control over racial composition
- 2. Preferred/Non-Preferred countries - 1919-1929
- Preferred = Britain, USA, Aus, NZ and S.Africa - given financial assisstance to aid their move
- Non-Preferre = Poland, Romania and Russia - admitted in times of need + lowest paid jobs
- Non-Acceptable list = people from visible minorities eg Chinese - Exclusion Act of 1923 prevented them bringing family with them
- 3. Closed Door Policy 1980-1945
- Unemployment rose + gov. stopped all migration apart from family
- "Family Reunion" Category - those who are not entering the labour market + only from Britain and USA
- 4. 1946-1962
- Gov. sought to increase the number of migrants
- Renewed immigration was not allowed to alter the pop. composition of Canada
- 5. 1960- 1986
- Racist undertones removed - attention was now on the skills of the migrants not the source.
- Preferred/non-preferred list abandoned in favour of points system - seen as a fairer method of selection
- Numbers were still highly controlled to reflect job availability - 1980's recession - migration was greatly reduced
- 6. 1986-1993
- Pop. ageing and fertility levels fallen close to replacement levels - mid 1980's
- Gov. viewed migration as a long term demographic necessity not just a short term solution to economic need
- Canada was at risk of under population - no longer necessary to have pre-arranged job before entering
- Numbers gaining entry increased from 85,000 in 1985 > 250,000 in 1993
- 7. 1993-2008
- Migration seen as essential requirement for demographic stability
- Still subject to points system - greater emphasis on technical + linguistic skills
- Gov. set annual target of 320,000 migrants
- Evaluation
- Positive
- 75% of growth in Canadas wokforce is due to migration
- Since 1992, immigration has accounted for 50% of overall pop. growth
- National Insurance contributions by migrants contribute to state pension funds + health care for elderly
- Migration has always been controlled to reflect perceived economic/demographic need
- More enlightened policies followed since 1967
- Canada is now a more global society as a result of changes in policy
- Establishment of "Family Reunion" category allowed close family to enter Canada
- Negative
- Earlier policies racist
- Migration always adjusted to needs of Canada - not migrant
- Attempts to re direct migrants to less well developed parts of the country have been unsuccessful
- Increase demand for services
- New migrants unable to find work
- Gov. reducing financial help to new migrants
- Positive
- Factfile
Informationen
- Beschreibung
- Mindmap am A3: Population Policies (i + ii), erstellt von Rachel Campbell am 23/02/2014.
- Erstellt von
- Rachel Campbell
- Aufrufe
- 91
- Bewertung