
Mindmap
Control Charts
Inhalt der Mindmap
Control Charts
Plot attribute data or variable data
- Attribute
- n=samples
- Fraction defective
- np= n constant
- p= n is not constant
- Quality characteristics is symbolized by number
- c=defects per group
- c= n constant
- u= defects per subgroup
- N= n is not constant
- Variable
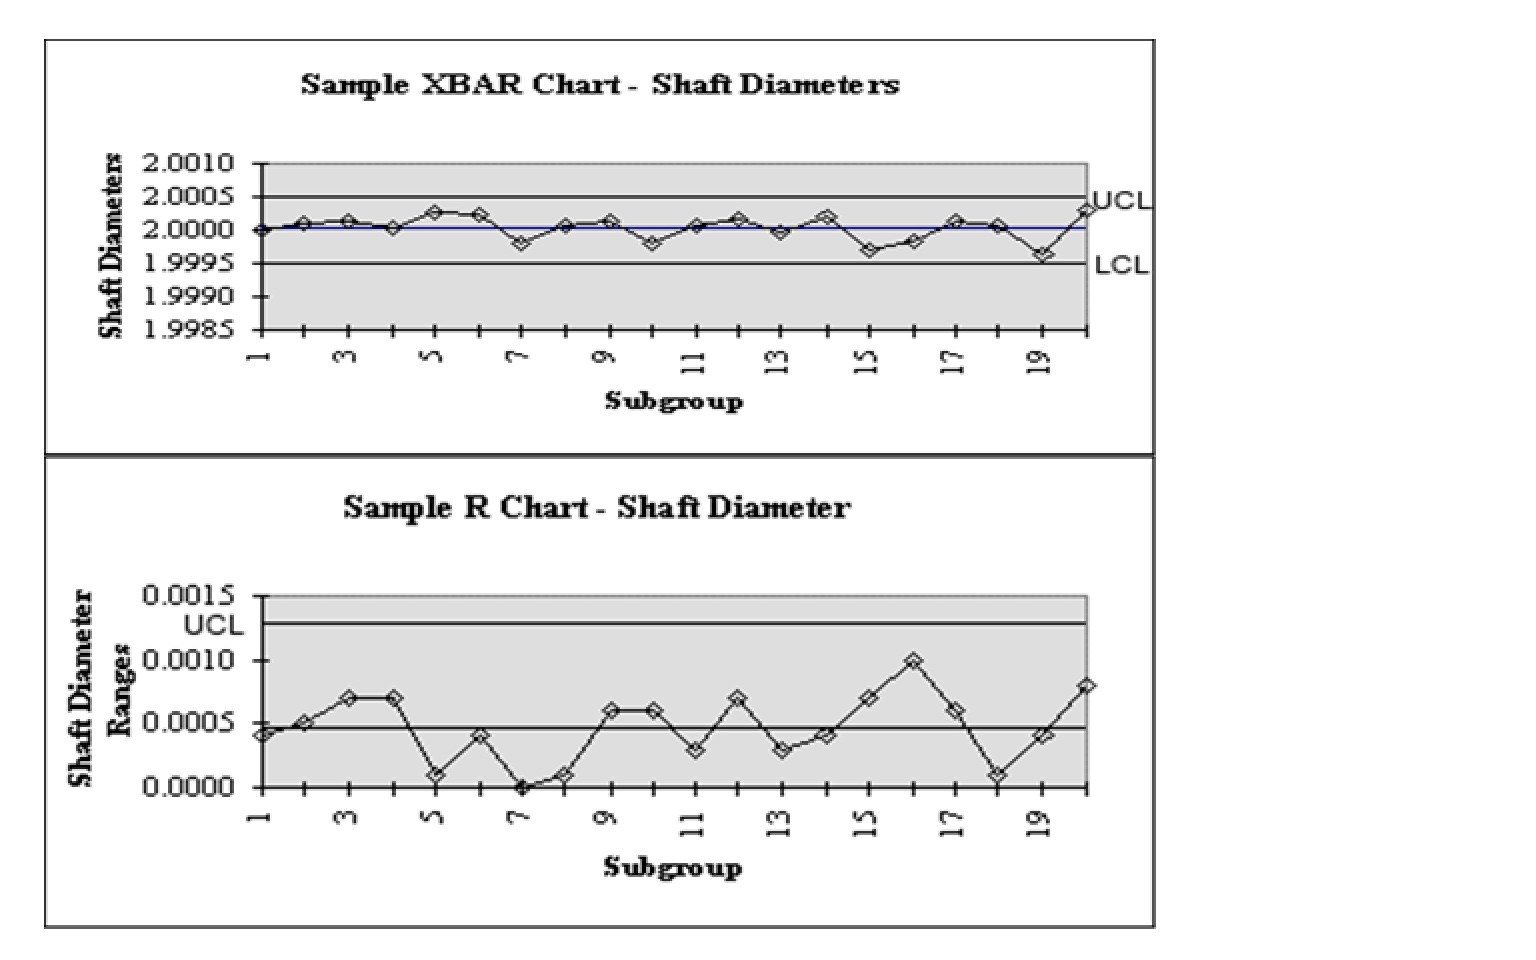
- X chart
- Individual, mesuared value
- Xbar-R
- Average value an range
- Xbar-R Chart(samples)
- Control & analyze process
- X Chart (Individuals)
- Obtained over extended time intervals
- X chart
- Attribute
Zone Rules(Western Electric)
- Designed to detect process instability and the presence of assignable causes
- Unnatural patterns from natural patterns based on criteria
- Absences of point near the center line(mixtures)
- Absence of points near the control (stratification)
- Presence of points outside the control limits(instability)
- Systematic, repetitions, trend pattterns
- How the Zone rules work?
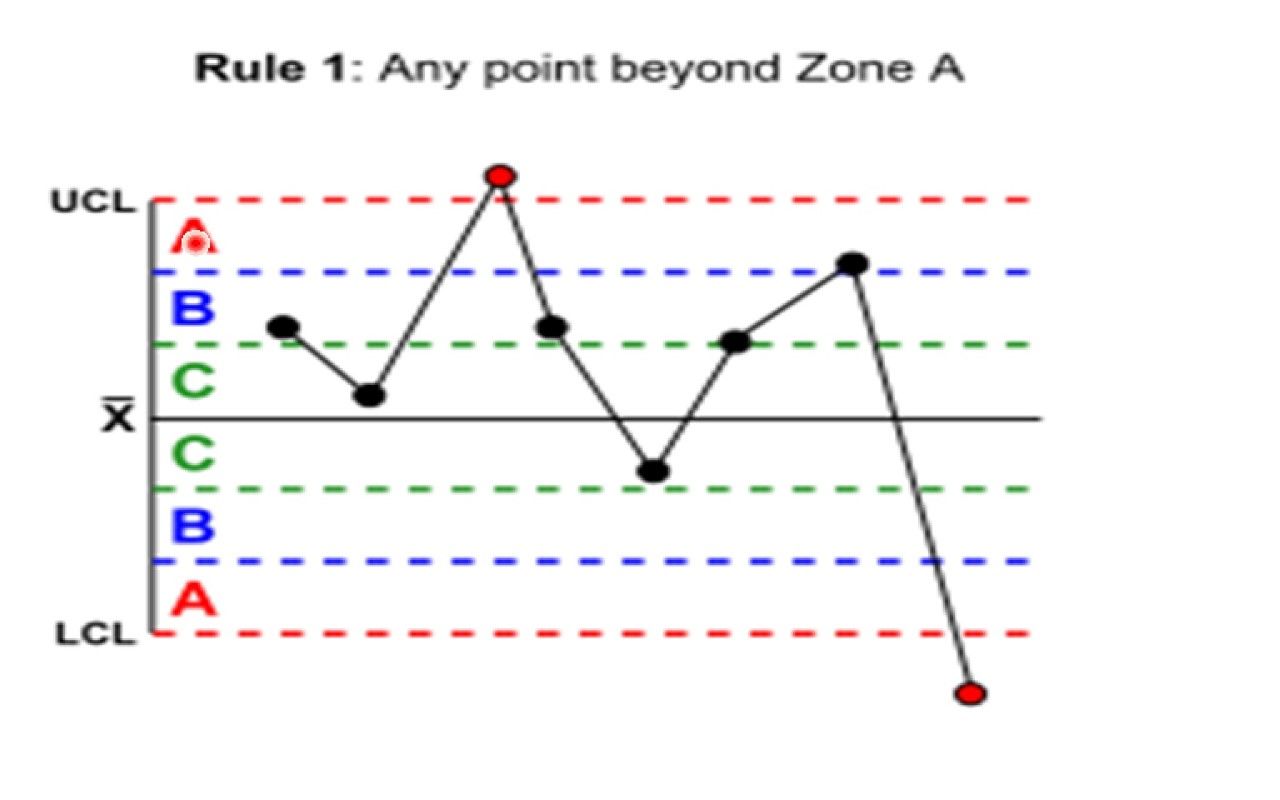
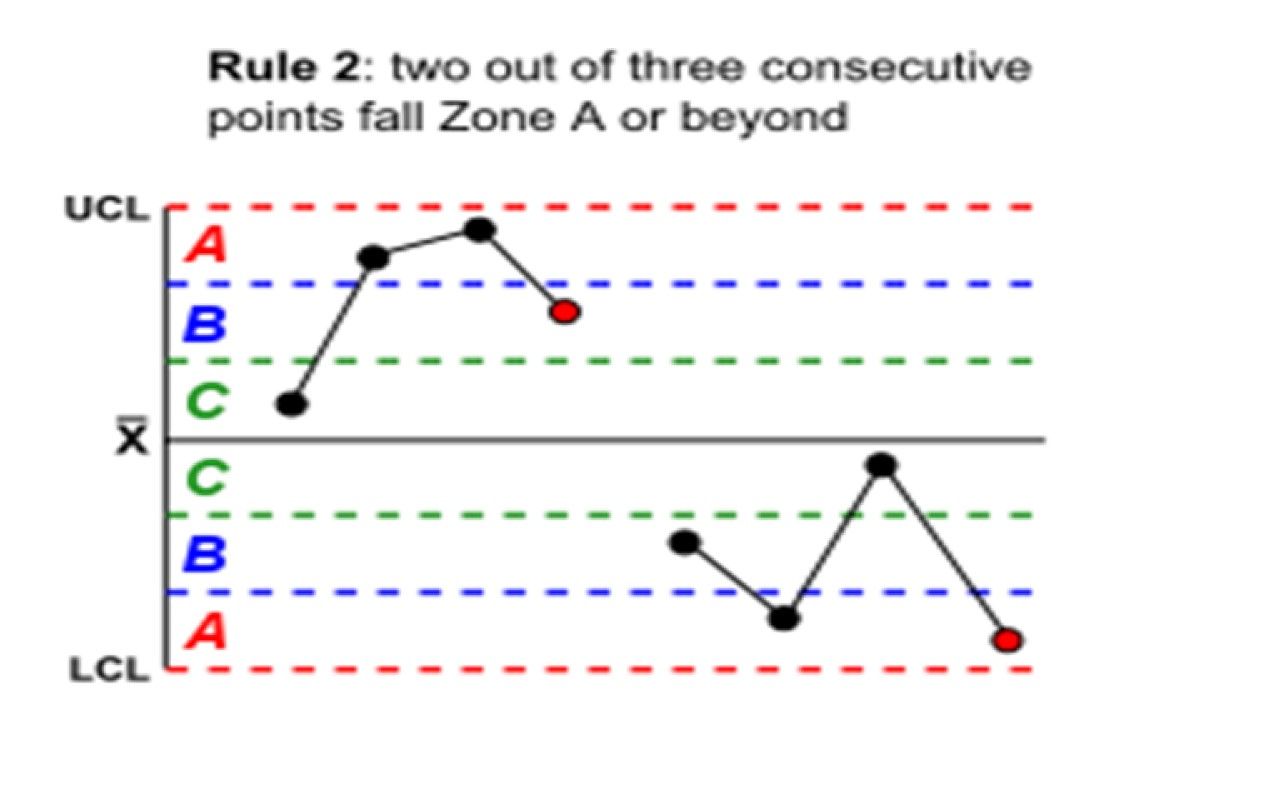
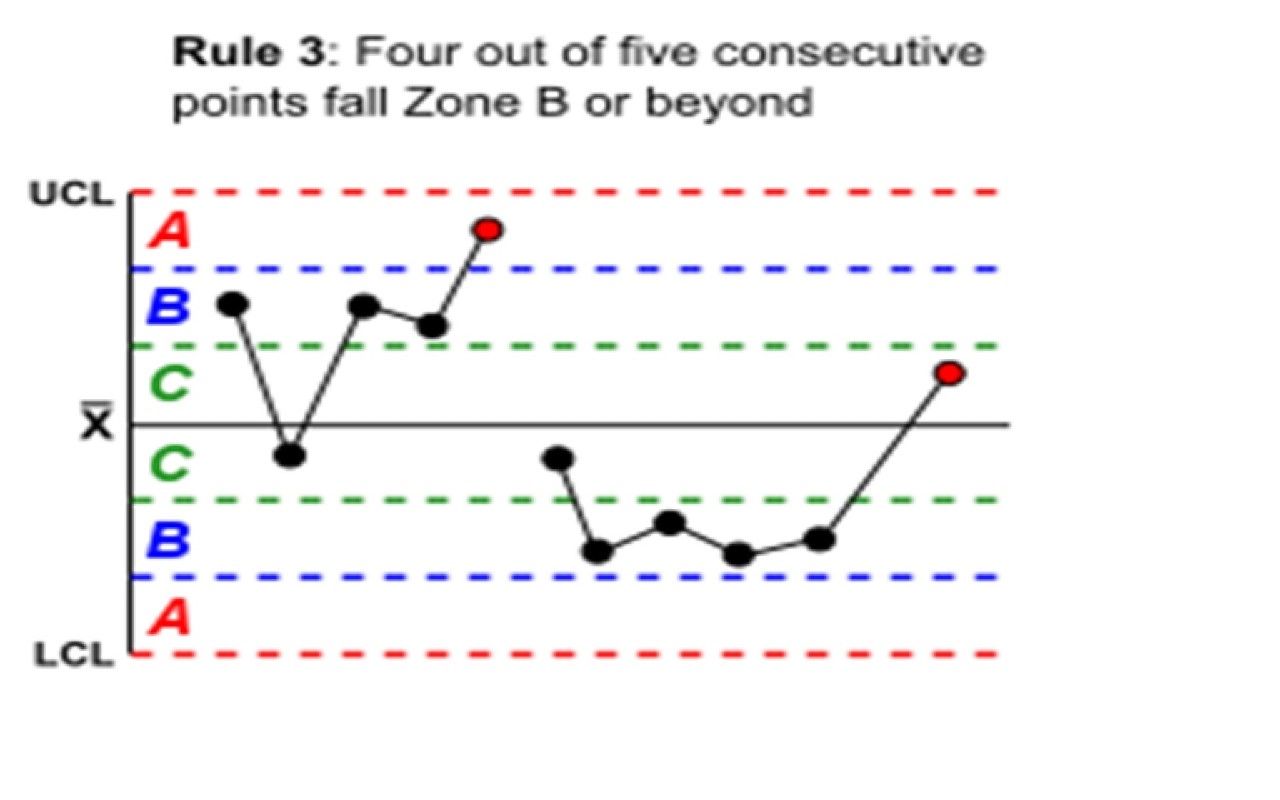
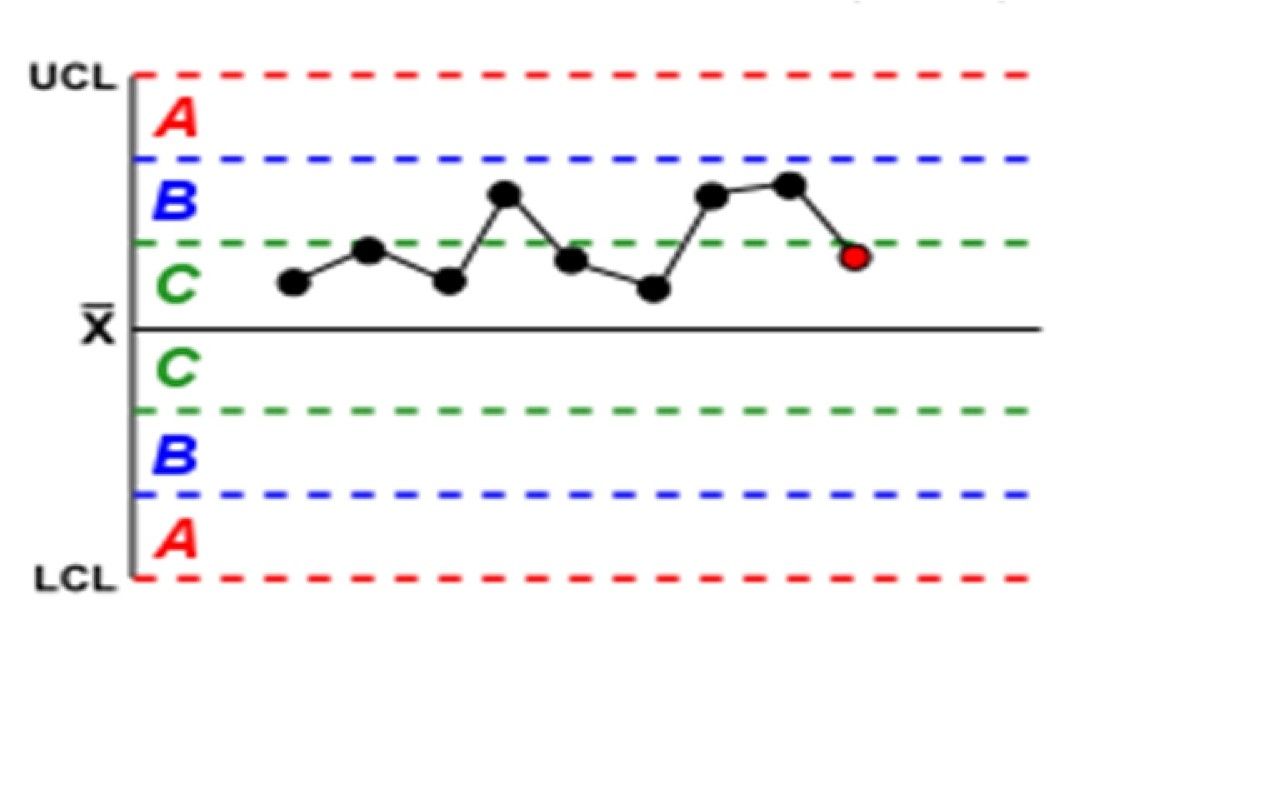
- Divided the control chart into zones
- Zone A( 2σ-3σ)
- Zone B(1σ-2σ)
- Zone C(1σ)
- Divided the control chart into zones
- Zone Rules Nª
- 1.- Any point falls outside the 3σ center line(upper or lower of the control limit)
- 3.-Four or five points fall beyond 1 σ(zone B)
- 2.- Two or three points fall beyond 2 σ(zone A)
- 4.-Seven or more points fall beyond 3 σ
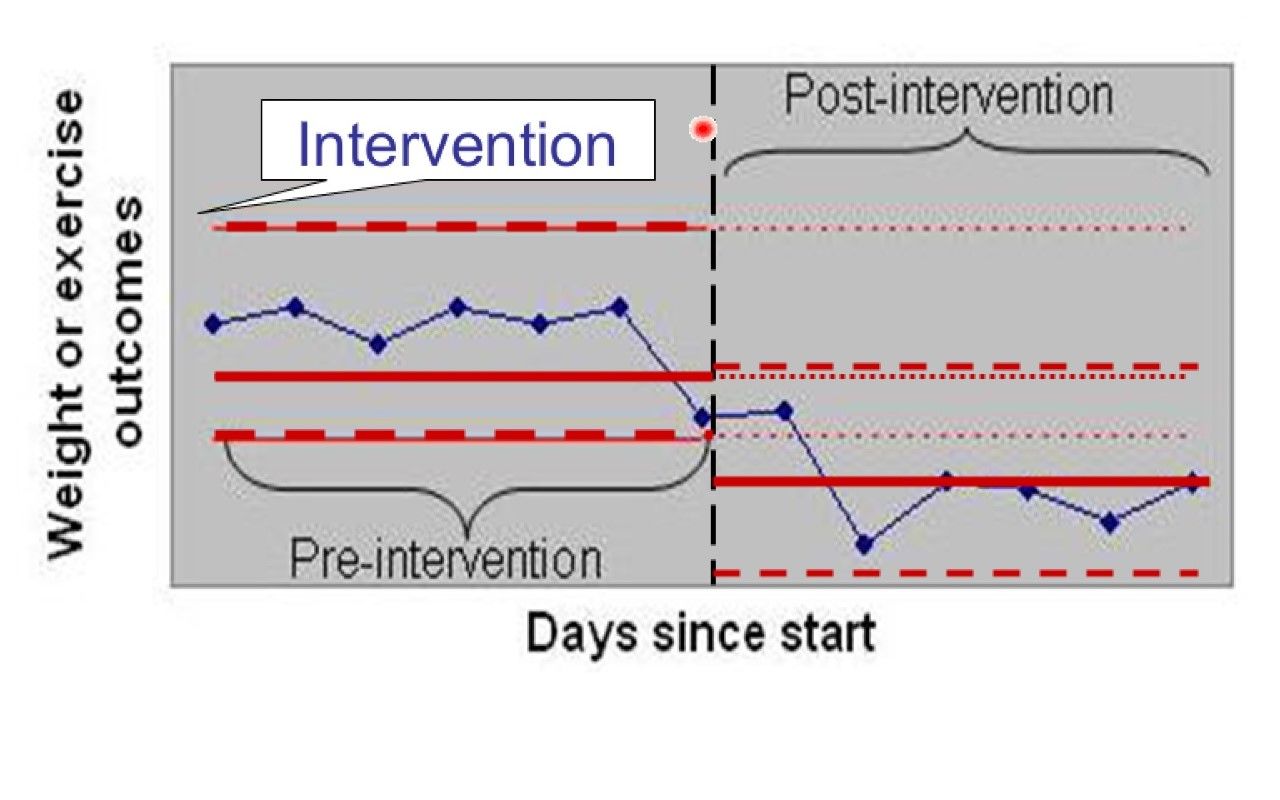
- Results of applying zone rules
- Change in the process
- Reduce 3σ
- Change in the process
- 1.- Any point falls outside the 3σ center line(upper or lower of the control limit)
Bilder und Dateien der Mindmap
Informationen
- Beschreibung
- Mindmap am Control Charts, erstellt von Renato Hernández am 24/02/2017.
- Erstellt von
- Renato Hernández
- Aufrufe
- 0
- Bewertung