
Karteikarten
Statistics Key Words
Karten in diesem Stapel (19)
- 1MeanMean is a measure of central tendency. Sum of numbers/total number of numbers
- 2ModeMode is a measure of central tendency. Most common number
- 3MedianMedian is a measure of central tendency. Middle number
- 4Central TendencyGives an indication of the "middle" of a set of data. it is measured using the mean, median and mode. Each of these is calculated differently and the one that is best to use depends on the data you have
- 5RangeRange = Largest - smallest
- 6Interquartile rangeUpper quartile - lower quartile.
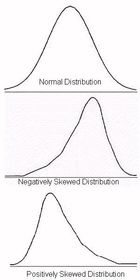
- 7Shape of distributionShape refers to whether a data is normally distributed, skewed left/negatively or skewed right/positively
- 8OutlierA value that "lies outside" (is much smaller or larger than) most of the other values in a set of data.
For example in the scores 25,29,3,32,85,33,27,28 both 3 and 85 are "outliers". - 9Primary v Secondary DataPrimary data is data you collect yourself through survey/experiment/investigation.
Secondary data is data you find through a newspaper/website/etc. Basically data that someone else has collected - 10Categorical v NumericalCategorical data is non-numerical data and can be ordered or nominal
Numerical data has numbers and can be discrete or continuous - 11BiasBias occurs when the survey sample does not accurately represent the population.
The bias that results from an unrepresentative sample is called selection bias - 12Simple Random SampleRandom sampling is a procedure for sampling from a population in which:
(a) the selection of a sample unit is based on chance
(b) every element of the population has an equal chance of being selected. - 13RepresentativenessIt is the closeness of the sample to the population from which the sample has been taken
- 14PopulationA population is any entire collection of people, animals, plants or things from which we may collect data. It is the entire group we are interested in, which we wish to describe or draw conclusions about.
- 15SampleA sample is a group of units selected from a larger group (the population).
- 16ParameterA parameter is a value, usually unknown (and which therefore has to be estimated), used to represent a certain population characteristic
- 17StatisticA statistic is a quantity that is calculated from a sample of data.
- 18CensusCollection of data from a whole population rather than just a sample
- 19Sampling VariabilityDifference (or variance) between sample statistics from different samples. Example: If I ask 10 people their height and find the mean height of those, it may well be different to the mean height of another 10 people I ask. This difference is sampling variability
Informationen
- Beschreibung
- Der Nutzer hat seine Fachbereichs-Information gelöscht. Karteikarten am Statistics Key Words, erstellt von Gelöschter Nutzer am 13/03/2018.
- Erstellt von
- Gelöschter Nutzer · Mär 2018
- Aktualisiert
- 13 Mär 2018
- Aufrufe
- 14
- Tags
- Verlauf
-
- Erstellt von Culan O'Meara · 25 Sep 2014
- Kopiert von Joey Bandelow · 13 Mär 2018
- Bewertung