
Physics
Folien in diesem Satz (19)
-
- Base Quantities:
- A quantity that can be measured, example length, mass, weight, time etc.
- A quantity must contain a numerical value and unit, example mass of object equals 60 kg but weight is equal to 600 N.
- When units are not present it is incorrect
- Dimension less quantities are the exception to this rule, example refractive index and relative density.
- Physical quantities can be separated into base quantities and derived quantities.
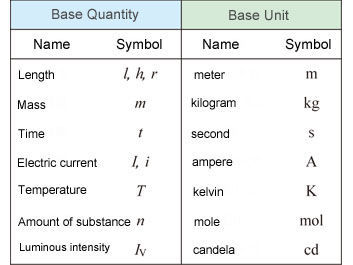
- Bildunterschrift: Table of Base Quantities and S.I. Units
-
- Derived Quantities:
- A combination of base quantities.
- A derived unit is expressed as products or quotients of base units
- Example, Speed =Distance/Time =Meter/ second =m/s
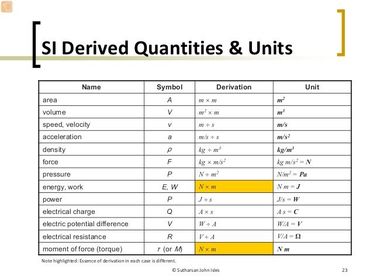
- Bildunterschrift: Derived Quantities and there S.I. Units
-
- Number of places after the decimal point, example, 2.54 is written to 2 decimal points
-
- Tells us about precision.
- Zeros at the front of a significant figure are not included.
- The ones in the middle are included.
- Example 5674 is written to 4 significant figures, 0.6423 as well.
- 6472 is written as 6470 to 3 significant figures, 6500 to 2 significant figures, and 6000 to one.
- Round up/ down to the nearest none zero number.
-
- A simple form of very large or small quantities.
- Example: 330 in standard form is 3.3 x 10^2 or 0.022 is 2.2 x 10 ^(-2)
-
- Random Errors:
- Caused by unknown, unpredictable events that may occur during the experiment.
- Changes may occur in measuring instruments and environmental conditions, example, a wind surge.
- Systematic Errors:
- Occurs when something is wrong with the measuring instrument or its data carrying system
- Or if wrong readings are taken off of the instrument.
- Parallax Error:
- Mostly committed error in physics.
- Occurs when readings aren't taken at eye level.
-
Instruments and what they measure
- Measuring Mass
- Done using an Analog or Digital Scale.
- Measuring Volume of a Liquid
- Done using a measuring cylinder, it is read at eye- level, to avoid errors.
- Measuring Volume of a Solid
- If the object is regularly shaped like a rectangle, it would be L x B x H
- If the object is irregularly shaped we use 2 things.
- Displacement Can
- Measuring Cylinder
-
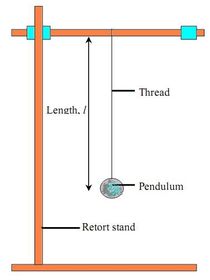
- A simple pendulum hanging from a string of length, l.
- A fixed pivot point, p.
- When displaced to initial angle the pendulum will swing back and forth with periodic motion.
- Factors Affecting a Simple pendulum
- The size of the swing ( amplitude).
- The size of the bob.
- The size/ length of the thread.
- \Note well:
- The swing is one complete cycle
- The time for a complete cycle, called the period of cycle.
-
- A straight line is in the form y = mx + c.
- x = x- axis coordinates
- y = y- axis coordinates
- m= Gradient
- c= y - intercept (constant)
-
- Scalar:Has Magnitude only
- Mass
- Time
- Temperature
- Energy
- Power
- Speed
- Work
- Resistance
- Vector:Has Magnitude and Direction
- Velocity
- Acceleration
- Friction
- Weight
- Momentum
- Force
-
- Vectors can be represented by a line drawn in a particular direction.
- The length of the line is the vector's magnitude.
- The direction of the line is the direction of the vector.
- Two forces acting in the same direction, the net/ total cost can be shown as follows:
- 4N ---------> + 6N -----------------> + 10 N -------------------------------->
- Two forces acting in opposite directions, the net/ total force can be shown as follows:
- 6N -----------------> + <------------ 4N = 2N ------>
-
- Two vectors are equal if the have the same magnitude and direction.
- The addition of 2 vectors A&B yields another vector, the resultant force of their sum.
- It is written as A+B
- There are 2 methods to adding vectors:
- Triangle of Vectors
- Parallelogram of Vectors
- The resultant force of 2 vectors can be drawn in the shape of a triangle of vectors.
- A&B are drawn so that the tail of Vector A touches the head of Vector B. The resultant will be an arrow from the tail of A to the head of B.
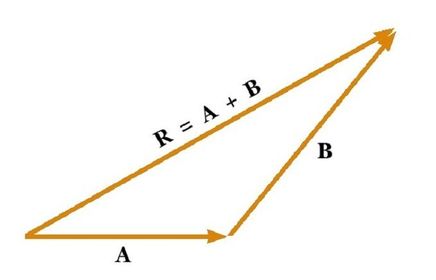
- Bildunterschrift: Triangle of Vectors
-
- This is the sum of 2 vectors.
- They are called components of the original vectors.
- They are taken at right angles to each other.
- The component 'F' can be found by Scale Drawings or by calculation.
- To Calculate 'F' using the y-axis, use Fsinθ.
- To Calculate 'F' using the x-axis, use Fcosθ.
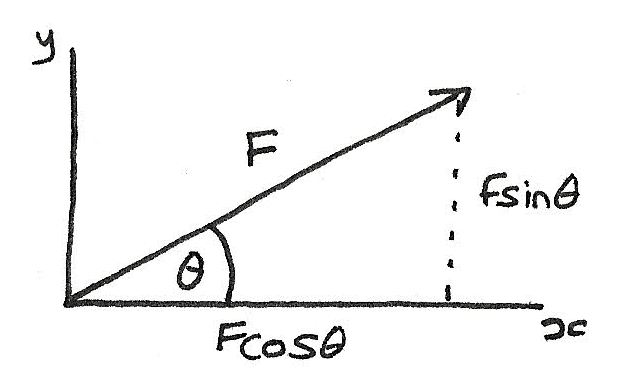
- Bildunterschrift: Components
-
- Speed - Calculated using the formula Average speed = Distance/ Time
- Velocity - Calculated using the formula, Velocity = Displacement/ Time
- Acceleration - Calculated using the formula, Acceleration = Change in velocity/ Time
- Acceleration - Calculated using the formula, Acceleration = Final Velocity - Initial Velocity/ Time
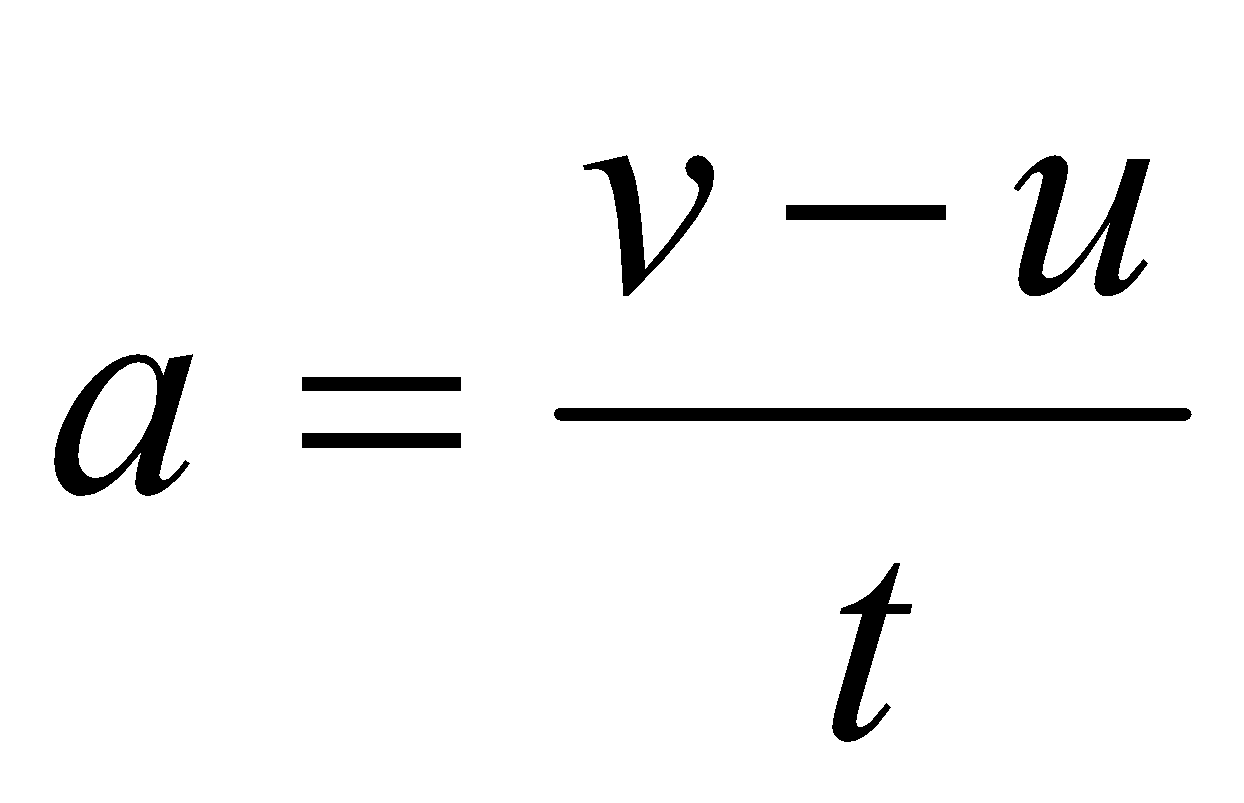
- Bildunterschrift: Formula for Acceleration
-
Motion cont'd - Ticker Tape Timer
- Can be used to determine velocity and acceleration.
- When the tape is pulled, 50 dots per second are produced.
- Evenly spaced dots show uniform velocity.
- If the distance between dot intervals increase.
- Increasing distance between dots shows acceleration.
- Decrease in distance between dots show deceleration.
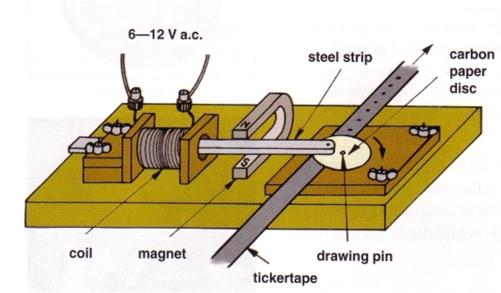
- Bildunterschrift: Ticker Tape Timer
-
- This is a graph obtained when the displacement of an object in motion is plotted against time.
- If the graph is a straight line then velocity is uniform or constant.
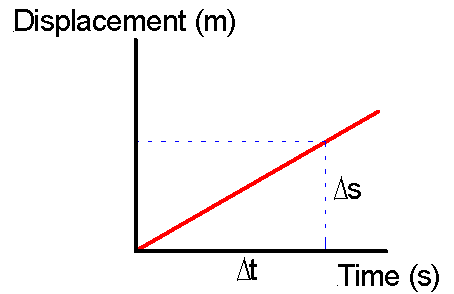
- Bildunterschrift: Displacement vs Time Graph showing Uniform Velocity
-
- This is a graph obtained when Velocity is plotted against Time.
- The gradient of the line is the magnitude of acceleration.
- A straight line indicates constant acceleration.
- The area below the graph gives the displacement, or distance travelled.
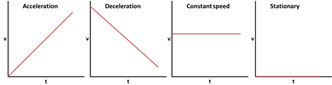
- Bildunterschrift: Velocity vs Time Graphs
-
- This is given the symbol 'g'.
- It is equal to 10 m/s.
- This is equivalent to 10 N/kg.
- It can be determined by using a simple pendulum experiment.
- The value of acceleration due to gravity is found using the equation g= 2h / t^2.
- g - gravity
- h - height
- t - time taken for the ball to fall through the height 'h'.
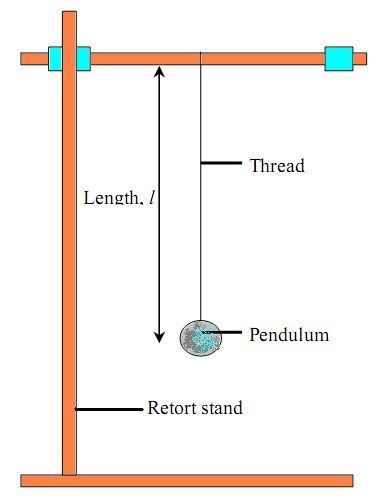
- Bildunterschrift: Simple Pendulum Experiment
-
- A force is a push or pull.
- When applied, it can cause an object at rest to move, an object in motion to change speed or direction and change in shape of an object.
- There are several kinds of Forces, gravitational forces, electric forces, magnetic forces, nuclear forces etc.
- The symbol of force is 'F', and its unit is the Newton, N.
- Forces is a vector quantity, represented by its size, direction and point at which the force is applied.
Informationen
- Beschreibung
- In this slide set all of term 1 physics will be covered.
- Erstellt von
- Caleb Merrique · Dez 2016
- Aktualisiert
- 28 Feb 2018
- Aufrufe
- 93
- Bewertung