
Karteikarten
275 - Cardiac and Vascular Function Curves
Karten in diesem Stapel (12)
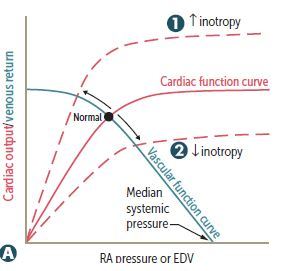
- 1Examples for 1?A - Inotrophy
1 - Catecholamines, digoxin ⊕ - 2Examples for 2?A - Inotrophy
2 - Uncompensated HF, narcotic overdose,
sympathetic inhibition ⊝ - 3Examples for 3?B - Venous return
3 - Fluid infusion, sympathetic activity ⊕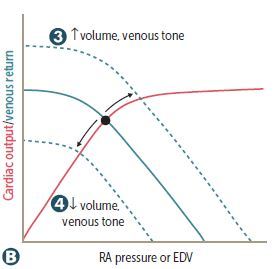
- 4Examples for 4?B - Venous return
4 - Acute hemorrhage, spinal anesthesia ⊝ - 5Examples for 5?C - Total peripheral resistance
5 - Vasopressors ⊕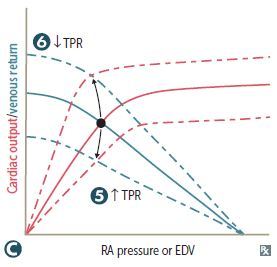
- 6Examples for 6?Exercise, AV shunt ⊝
- 7What does the intersection of curves on the graph indicate?Operating point of heart (ie, venous return and CO are equal)
- 8What is the effect shown on the Introphy graph?Changes in contractility --> altered CO for a
given RA pressure (preload). - 9What is the effect shown on the Venous Return graph?Changes in circulating volume or venous tone ---> altered RA pressure for a given CO. Mean systemic pressure (x-intercept) changes with volume/venous tone.
- 10What is the effect shown on the Venous Return graph?At a given mean systemic pressure (x
intercept) and RA pressure, changes in TPR
---> altered CO. - 11What is the following an example of? HF decreased inotropy ---> fluid retention to increase preload to maintain COChanges that occur in tandem and are compensatory
- 12What is the following an example of? exercise increased inotropy and decreased TPR to maximize COChanges that occur in tandem and are reinforcing
Informationen
- Beschreibung
- Der Nutzer hat seine Fachbereichs-Information gelöscht. Karteikarten am 275 - Cardiac and Vascular Function Curves, erstellt von Gelöschter Nutzer am 30/05/2017.
- Erstellt von
- Gelöschter Nutzer · Mai 2017
- Aktualisiert
- 30 Mai 2017
- Aufrufe
- 47
- Verlauf
-
- Erstellt von Victoria Wright · 29 Mai 2017
- Kopiert von Victoria Wright · 30 Mai 2017
- Bewertung