
Notizen
Climate graph
Inhalt der Notizen (1)
Seite 1
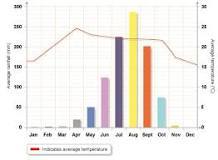
A climate graph is a chart that shows average weather for a certain period of time for a certain location. The precipitation is usually shown using a
bar graph and the temperature is usually shown as a line graph.
Informationen
- Beschreibung
- Notiz am Climate graph, erstellt von winterwolf111 1 am 01/06/2017.
- Erstellt von
- winterwolf111 1 · Jun 2017
- Aktualisiert
- 1 Jun 2017
- Aufrufe
- 0
- Bewertung