
Flussdiagramm
Factors that affect the Rate of Reaction Practical
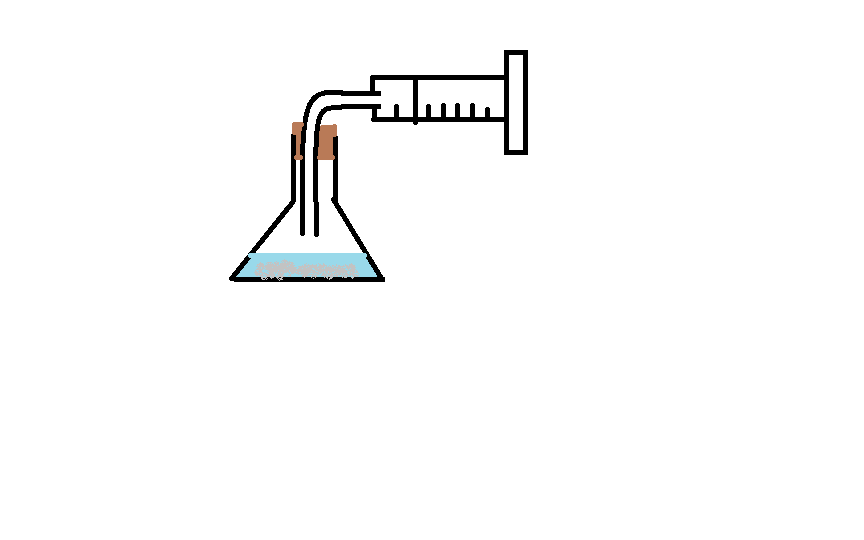
Inhalt des Flussdiagramms
Carbon dioxide collects in the syringe
Hydrochloric acid and calcium carbonate react in the beaker
Different factors can be varied in order to investigate their effect on the rate of reaction:
Surface area to volume ratio:
By repeating with marble chips and then calcium carbonate powder
Temperature:
By repeating with HCl at different temperatures
Concentration:
By repeating with concentrated and then dilute hydrochloric acid
Volume of gas collected is a measure of how much reaction has progressed
Measure the volume in syringe at several different times after the beginning of experiment
Plot Volume against Time
Only change one variable at a time
Start the timer as soon as the calcium carbonate is dropeed into the hydrochloric acid
The gradient of the volume vs time graph is the rate of reaction
If the gradient is steeper, the rate is faster
The gradient can be calculated by drawing a tangent to the curve at any point
To investigate the effect that catalysts can have on the rate of reaction:
Same experimental set-up but replace HCl and marble chips with hydrogen peroxide
Hydrogen peroxide decomposes naturally to hydrogen and oxygen but the rate of reaction can be increased using catalysts
Repeat the experiment using various catalysts such as manganese oxide, lead oxide, liver
Informationen
- Beschreibung
- Der Nutzer hat seine Fachbereichs-Information gelöscht. Flussdiagramm am Factors that affect the Rate of Reaction Practical, erstellt von Gelöschter Nutzer am 03/07/2017.
- Erstellt von
- Gelöschter Nutzer · Jul 2017
- Aktualisiert
- 3 Jul 2017
- Aufrufe
- 14
- Verlauf
-
- Erstellt von Niamh Ryan · 30 Jun 2017
- Kopiert von Niamh Ryan · 3 Jul 2017
- Bewertung