
Quiz
APHG Unit 2 Progress Check
Erstelle ein kostenloses Konto, um dieses Quiz zu beenden
Speichere deinen Fortschritt und sieh dir dein Endergebnis an.
oder mit deiner E-Mail registrieren
Schon ein Konto? Anmelden
Fragen in diesem Quiz (36)
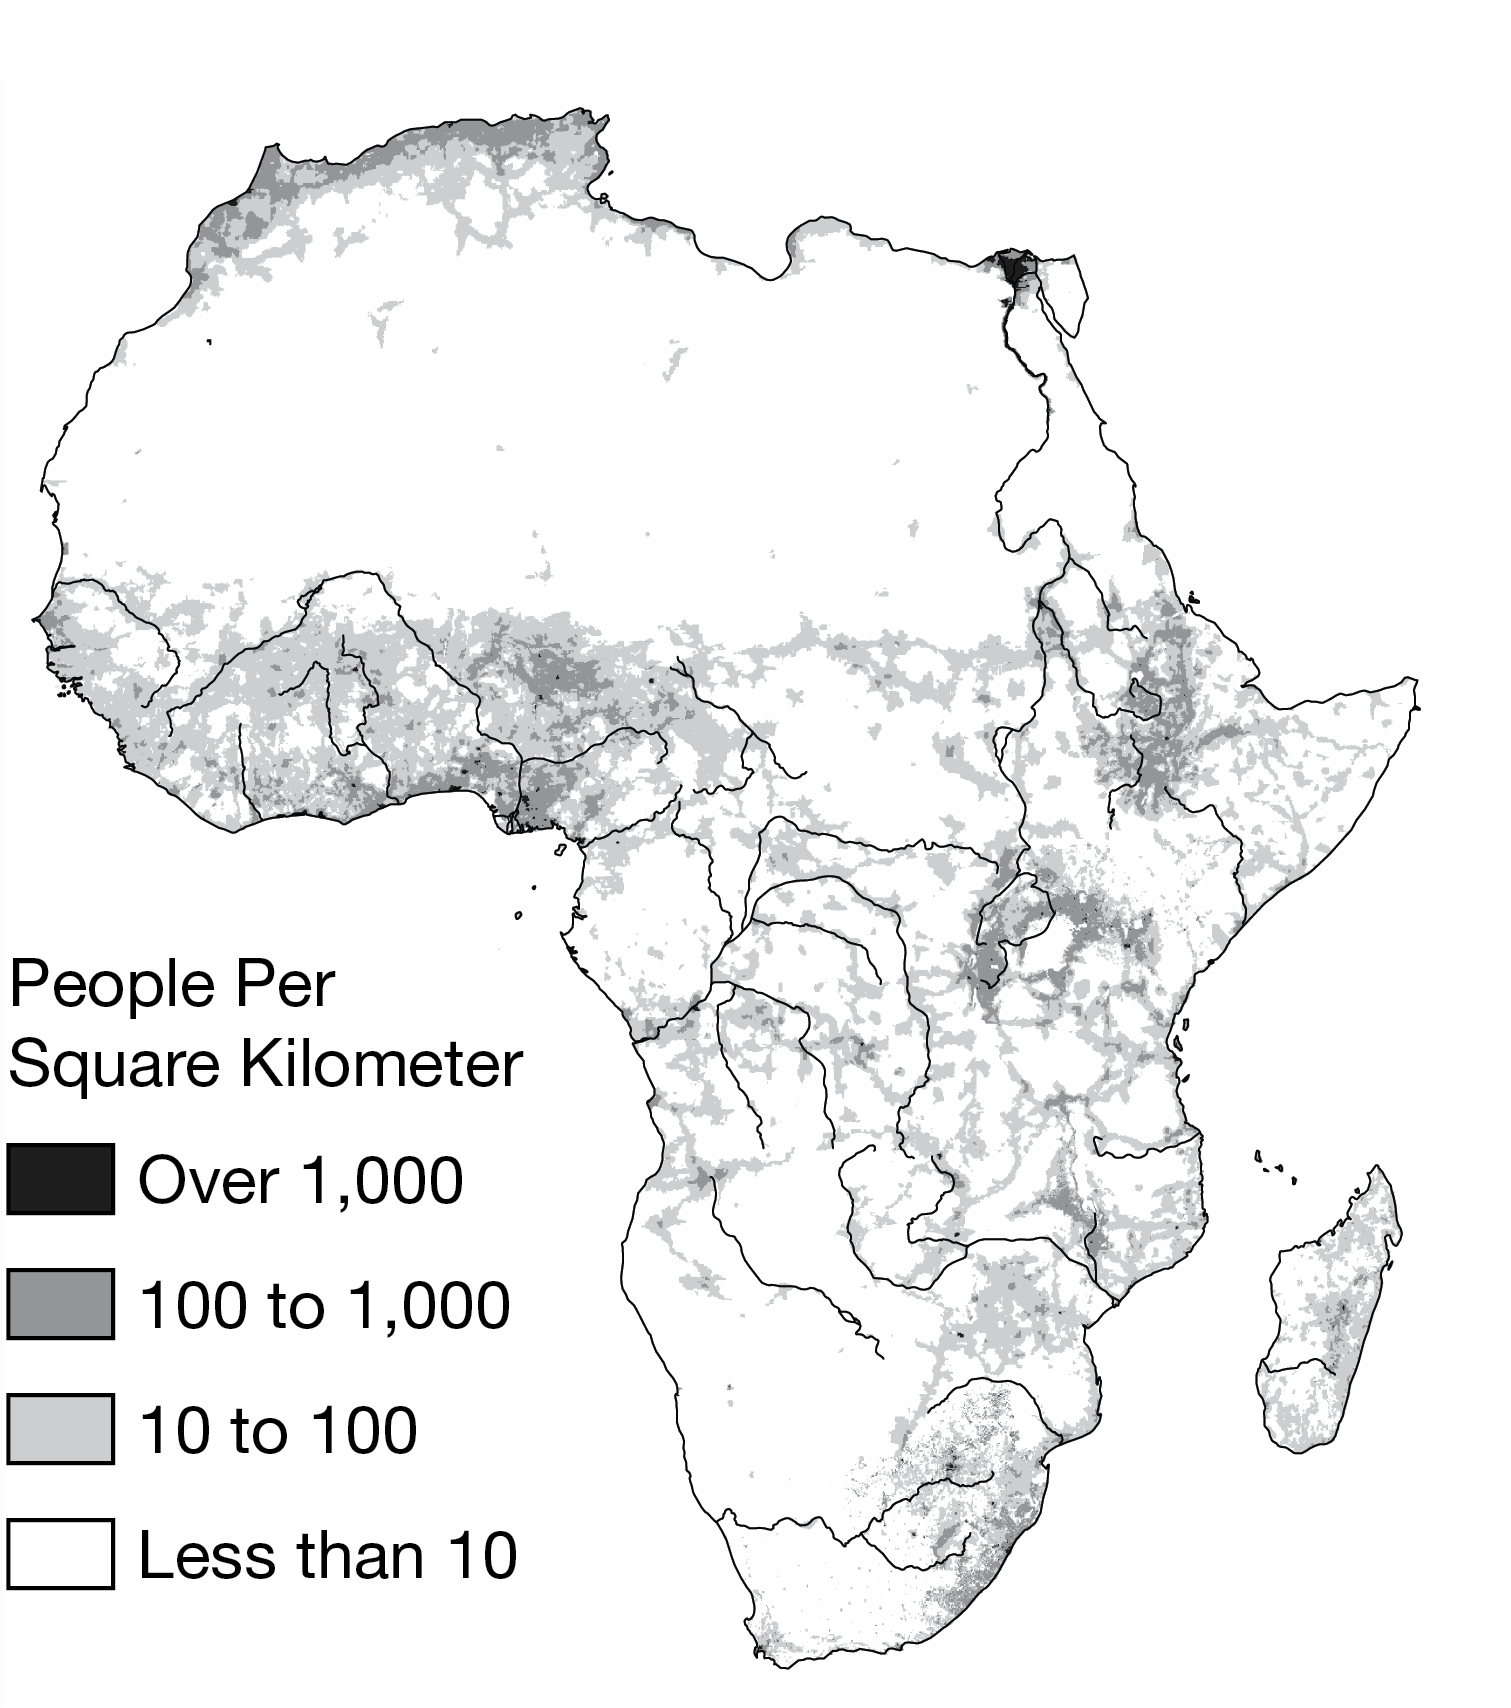
1Which of the following types of population information is shown on the map?
- ATransnational migration
- BInternal migration
- CAgricultural density
- Darithmetic density
- EPhysiological density
2Population patterns shown on the map indicate that areas around river deltas and upland lakes and river valleys have higher densities. Which of the following best explains why these regions are more heavily populated?
- AThese regions have pronatalist policies.
- BThese regions have access to international trade.
- CThese regions experience seasonal climate variation.
- DThese regions have mineral resources.
- EThese regions have higher carrying capacities.
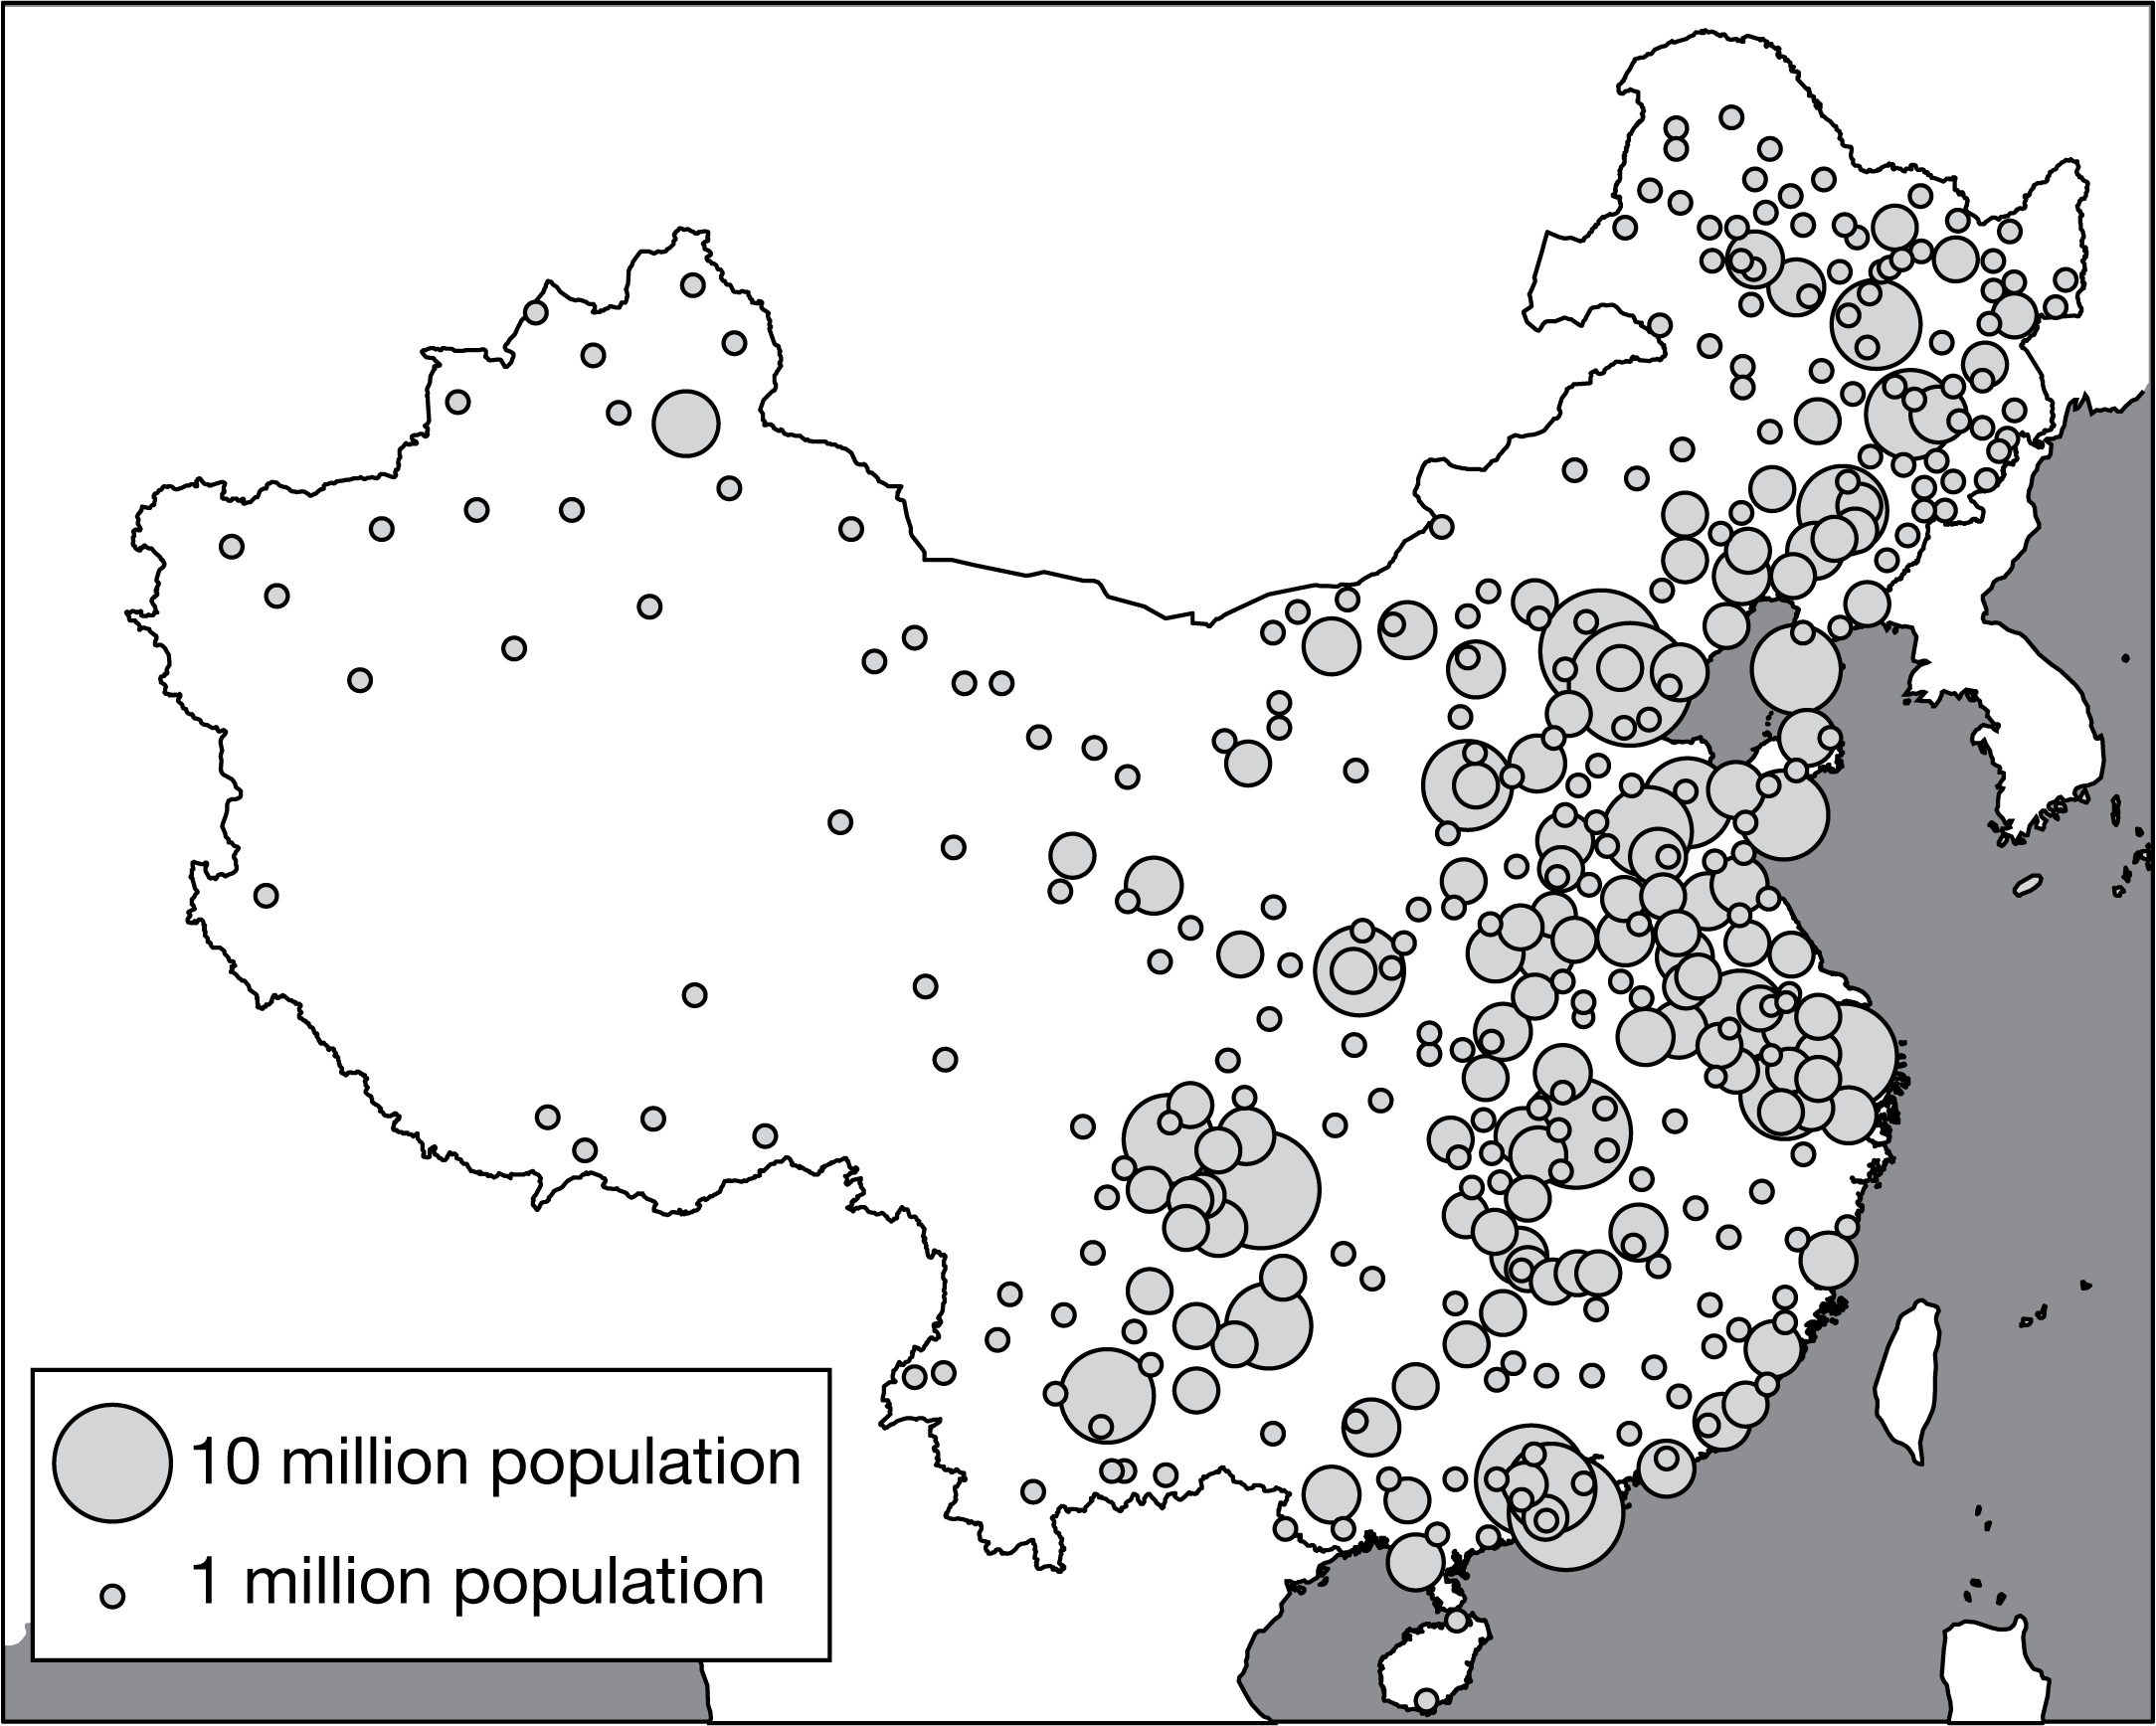
3Which of the following best identifies the data for western China, shown on the map?
- AHigh carrying capacity
- BLow population pressure
- CClustered population
- DHigh arithmetic density
- Elow arithmetic density
4If rural-to-urban migration continues in China, which of the following outcomes is most likely?
- AFarming will become unsustainable.
- BHousing shortages in urban areas will be common.
- CSchools in rural areas will not have enough students to remain open.
- DManufacturing areas will face labor shortages.
- EWages will increase in urban areas.
5Which statement best explains an environmental impact of China's population distribution?
- AThe population distribution shown allows for large-scale agricultural expansion in western China to increase the food supply.
- BB
The population distribution shown permits the dispersal of industrial air pollution outside of the region due to prevailing wind patterns. - CThe population distribution shown directs urban and industrial water pollution along riverways to less populated portions of the country.
- DThe population distribution shown depicts concentration in cities, which results in more open area to protect wildlife and preserve habitats.
- EThe population distribution shown requires more intensive use of limited soil and water resources to increase the carrying capacity of agricultural land.
6Which of the following patterns is indicated by the population pyramid shown?
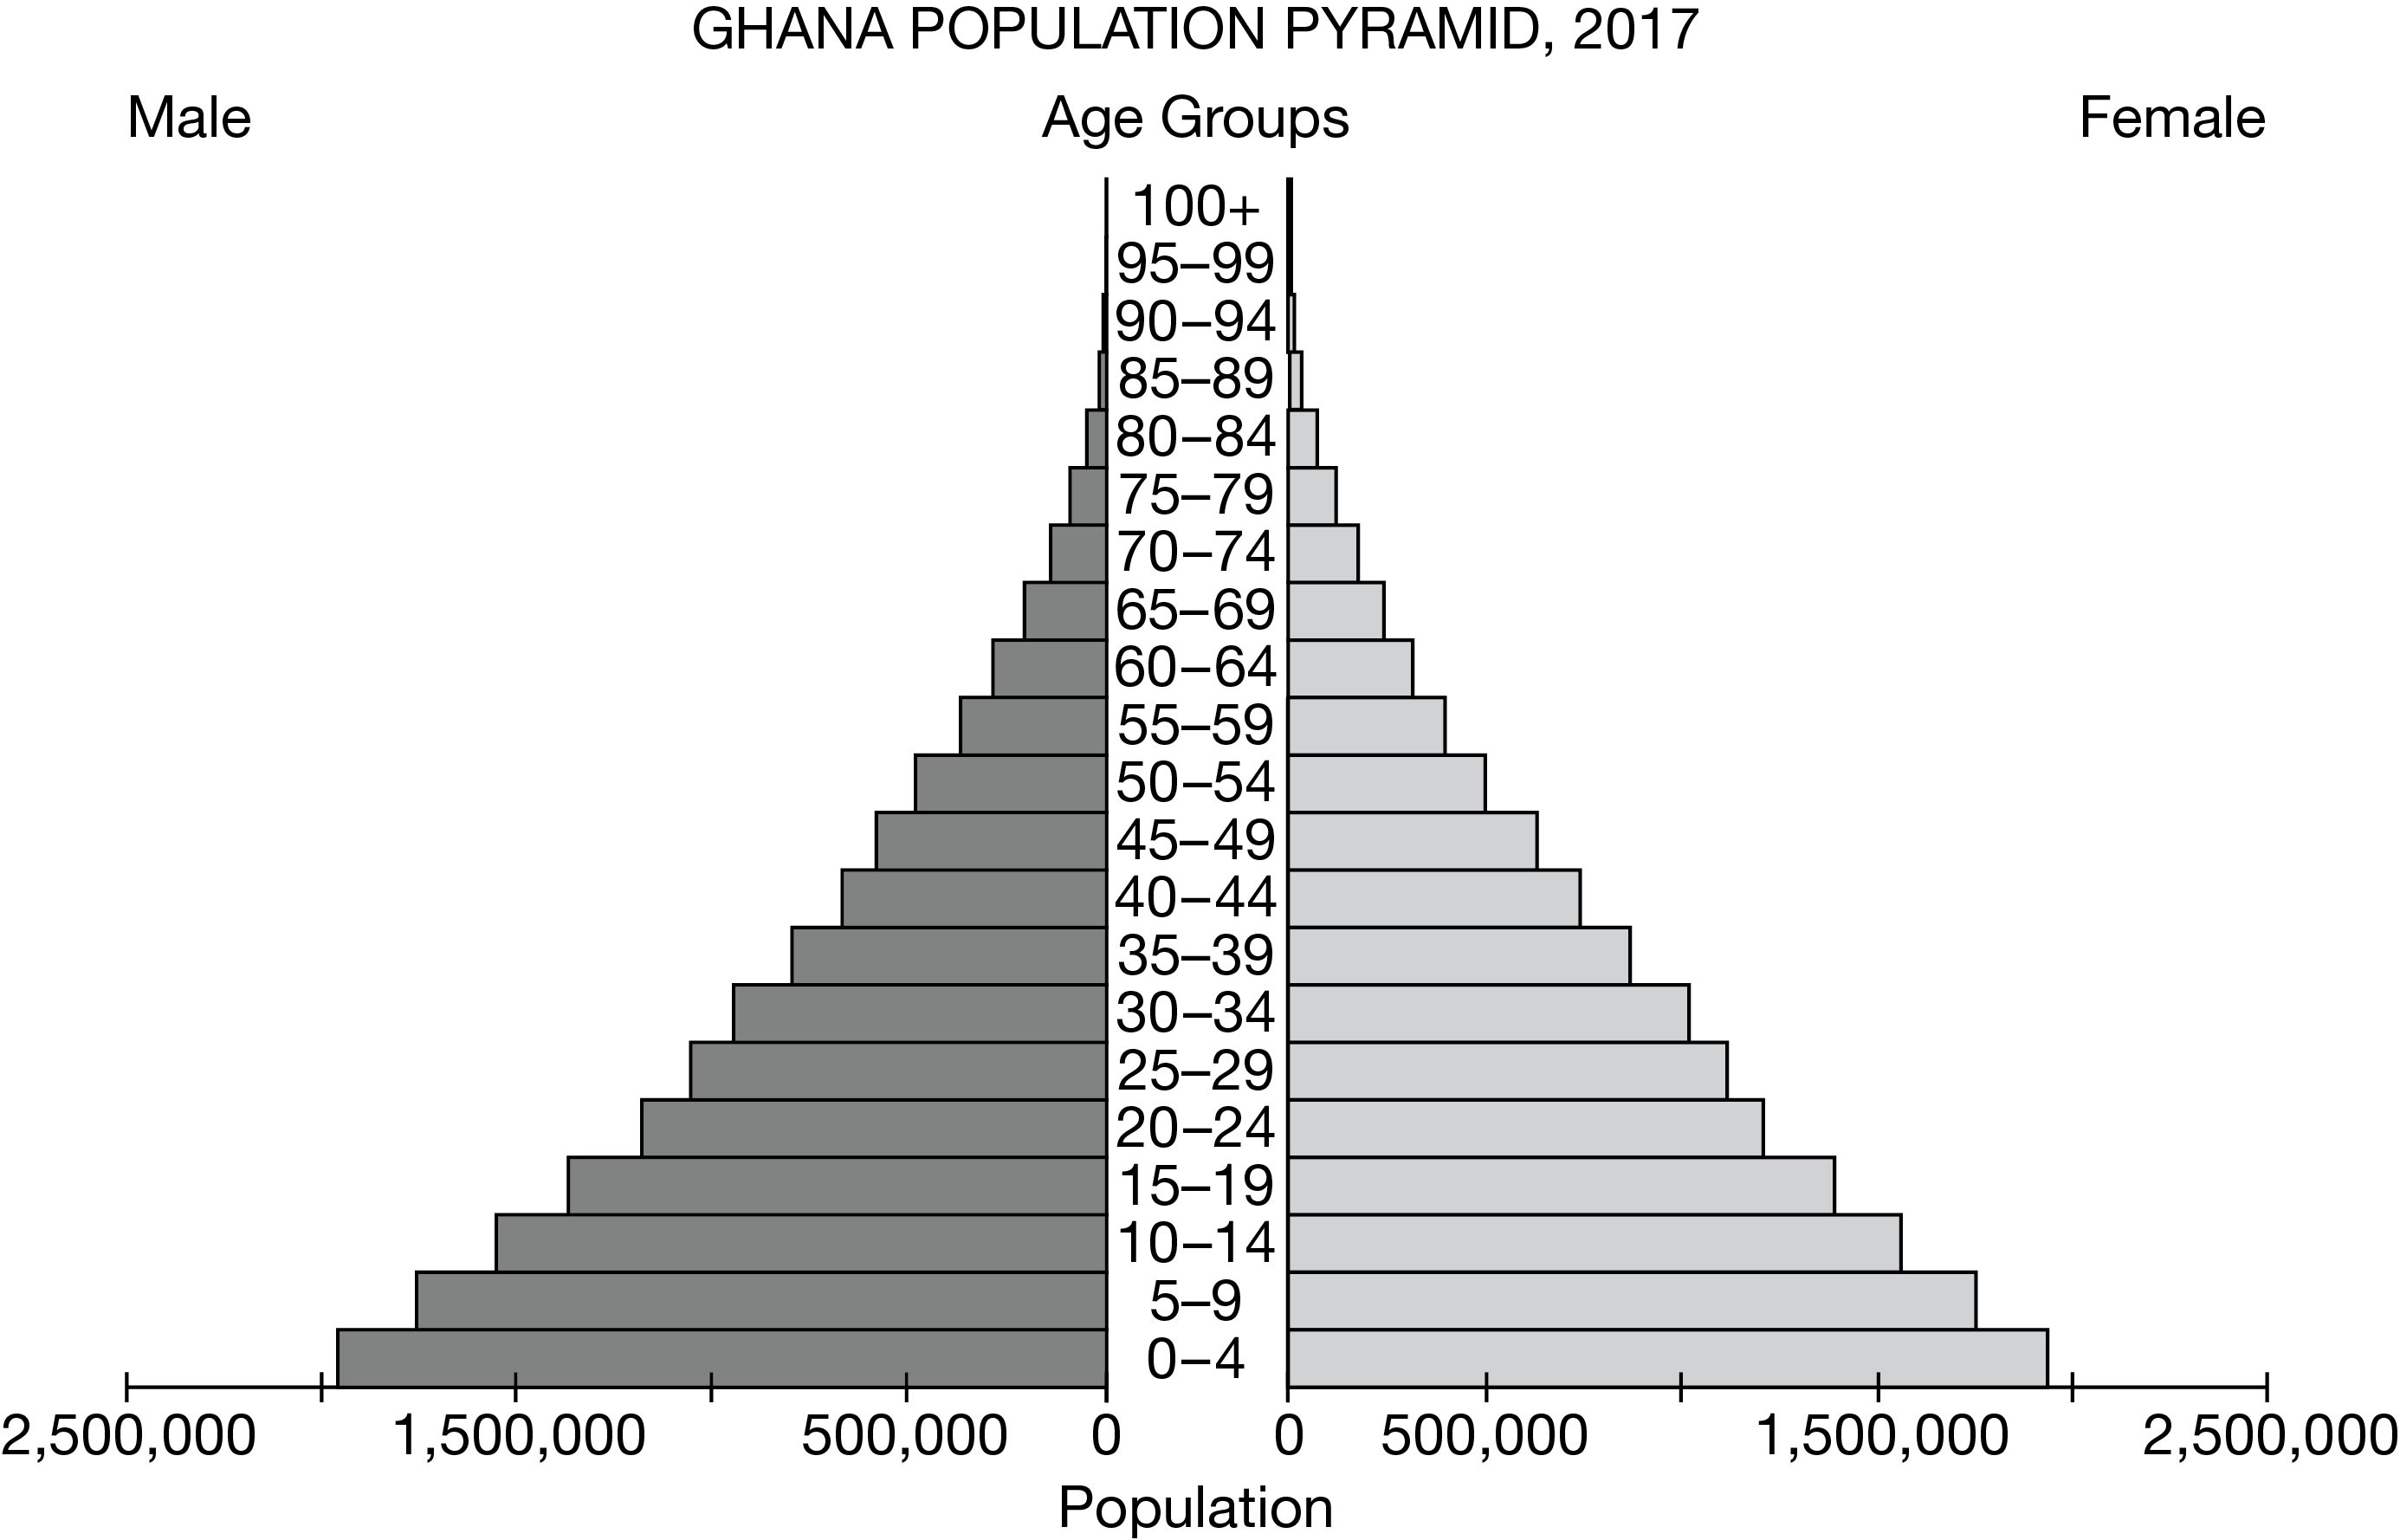
- ALevels of education and contraceptive usage are high among women.
- BGovernment policies encourage women to have multiple children.
- CThe population has a high total fertility rate.
- DD
Government policies discourage women from having multiple children. - EE
The population has a low infant mortality rate.
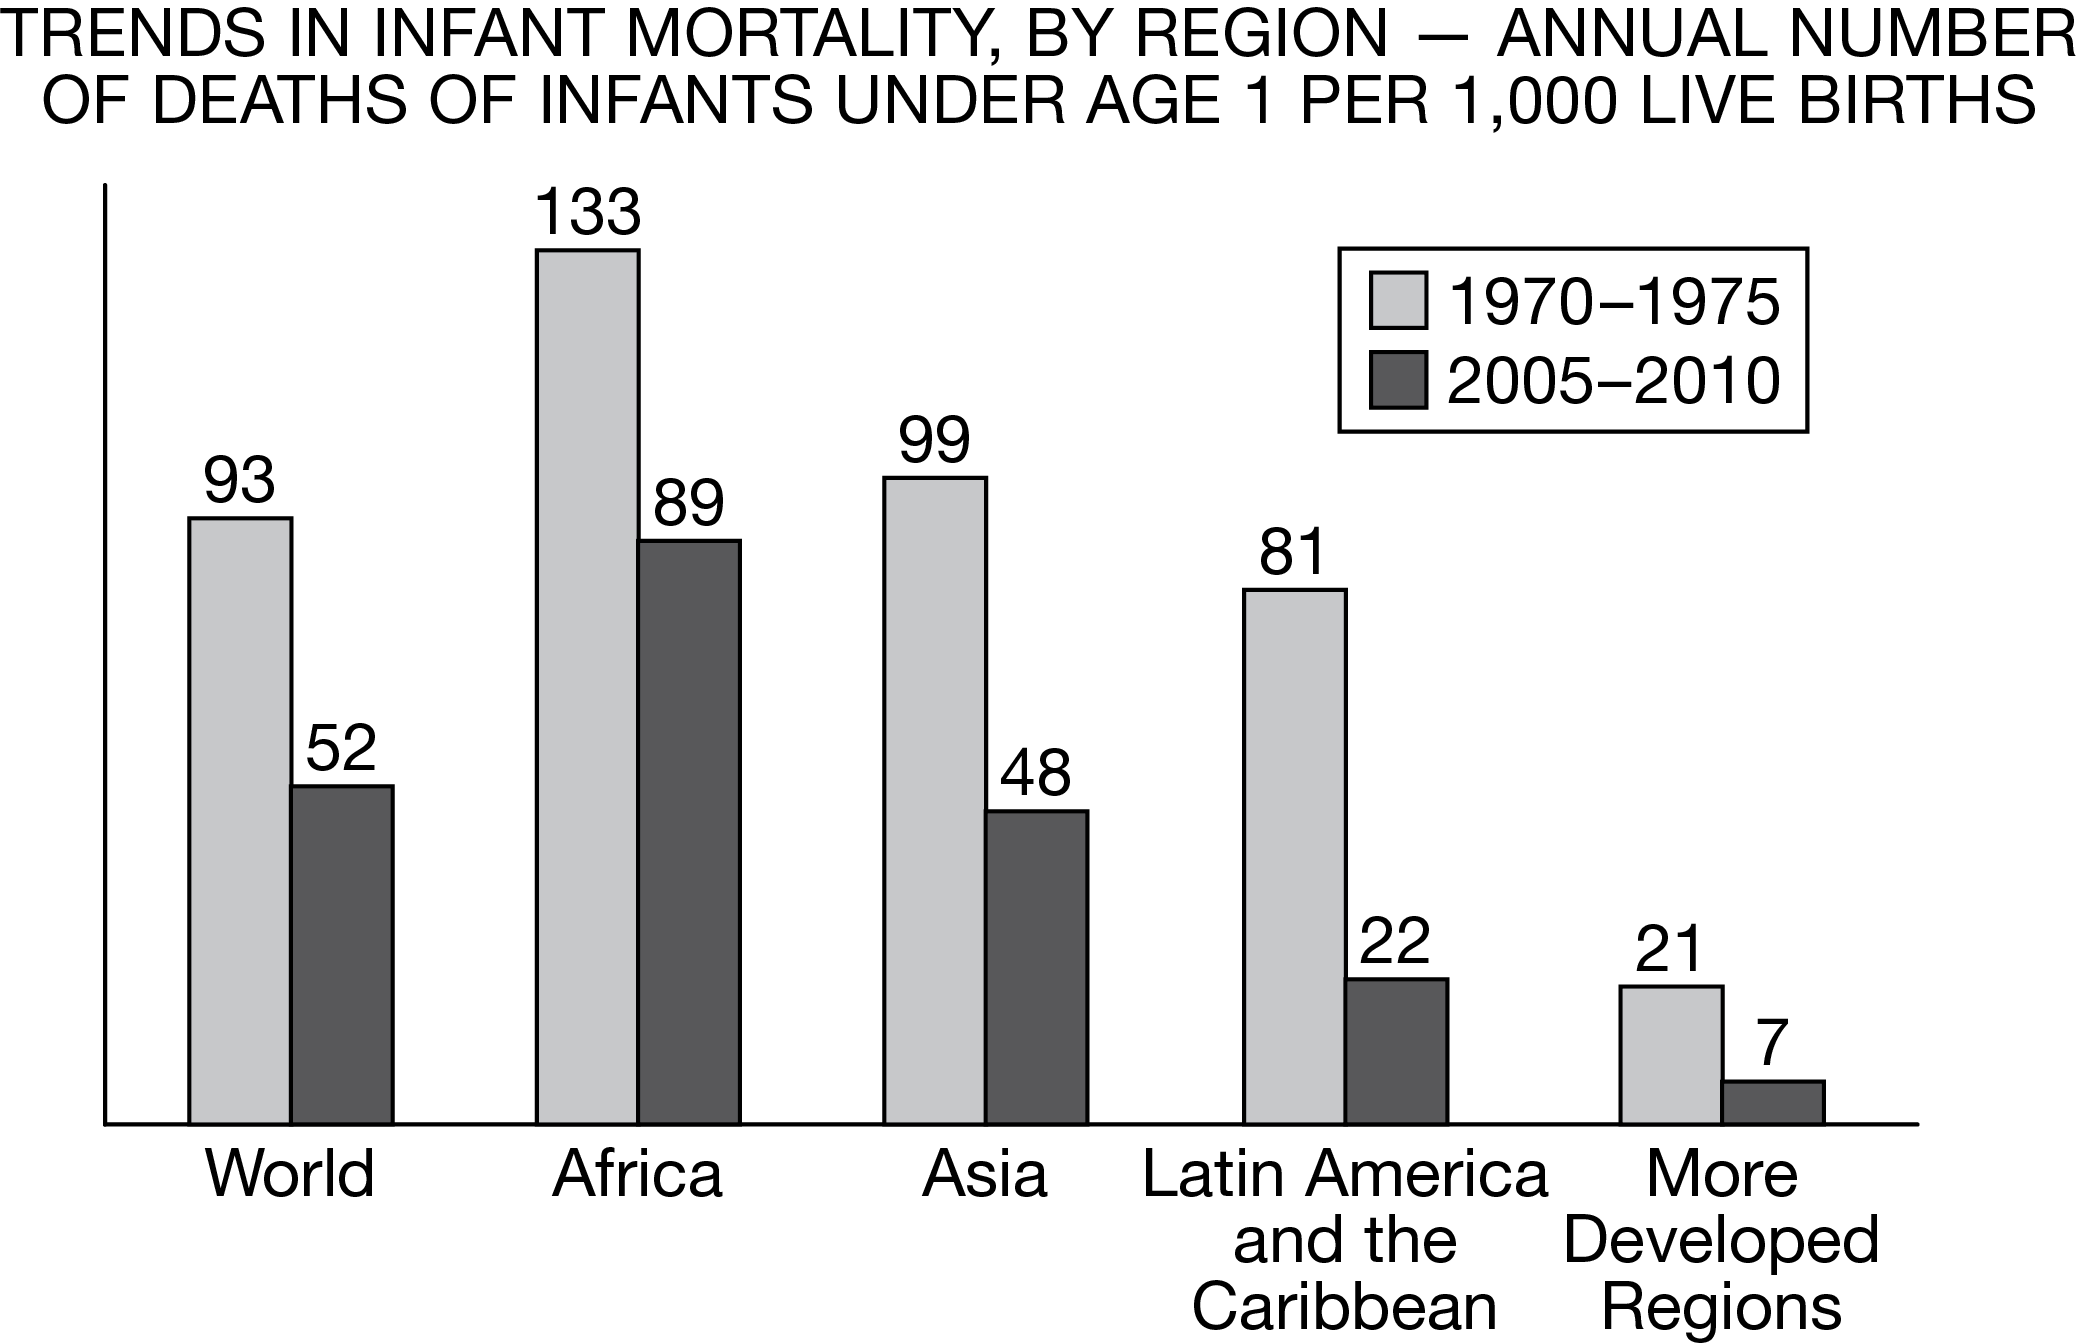
7Which of the following statements best explains the trend about infant mortality shown in the bar chart?
- AA
The trend can be explained by improvements in political participation and voting in all regions. - BB
The trend can be explained by rural to urban migration and the growth of cities in all regions. - CC
The trend can be explained by industrialization and improved job opportunities. - DD
The trend can be explained by improved health care and nutrition in all regions. - EE
The trend can be explained by improvements in communications and Internet access.
- AA
8A large number of Turkish people migrated to Germany in the 1960s, when West Germany’s manufacturing economy was booming and Turkey’s economy was predominantly agricultural. Which of the following best describes Turkish migration to Germany?
- AA
Political asylum seekers fleeing Communism - BB
Involuntary migrants fleeing transnational wars - CC
Internal rural-to-urban migrants - DD
Internally displaced persons - EE
Voluntary guest workers
- AA
9Which of the following best explains an effect of migration within the United States between 1950 and 2010 ?
- AA
The mean center of the population of the United States shifted to the South and West as workers migrated to areas with more jobs and a warmer climate. - BB
Population increased in the industrial North because of large-scale migration of African Americans from the South. - CC
Rapid suburbanization occurred in the Midwest as retirees migrated from the East Coast. - DD
Large clusters of migrants from other countries settled in the South and West, leading to significant population growth in this region. - EE
Population increased in the northeastern United States as large numbers of college graduates moved to this region to seek employment.
- AA
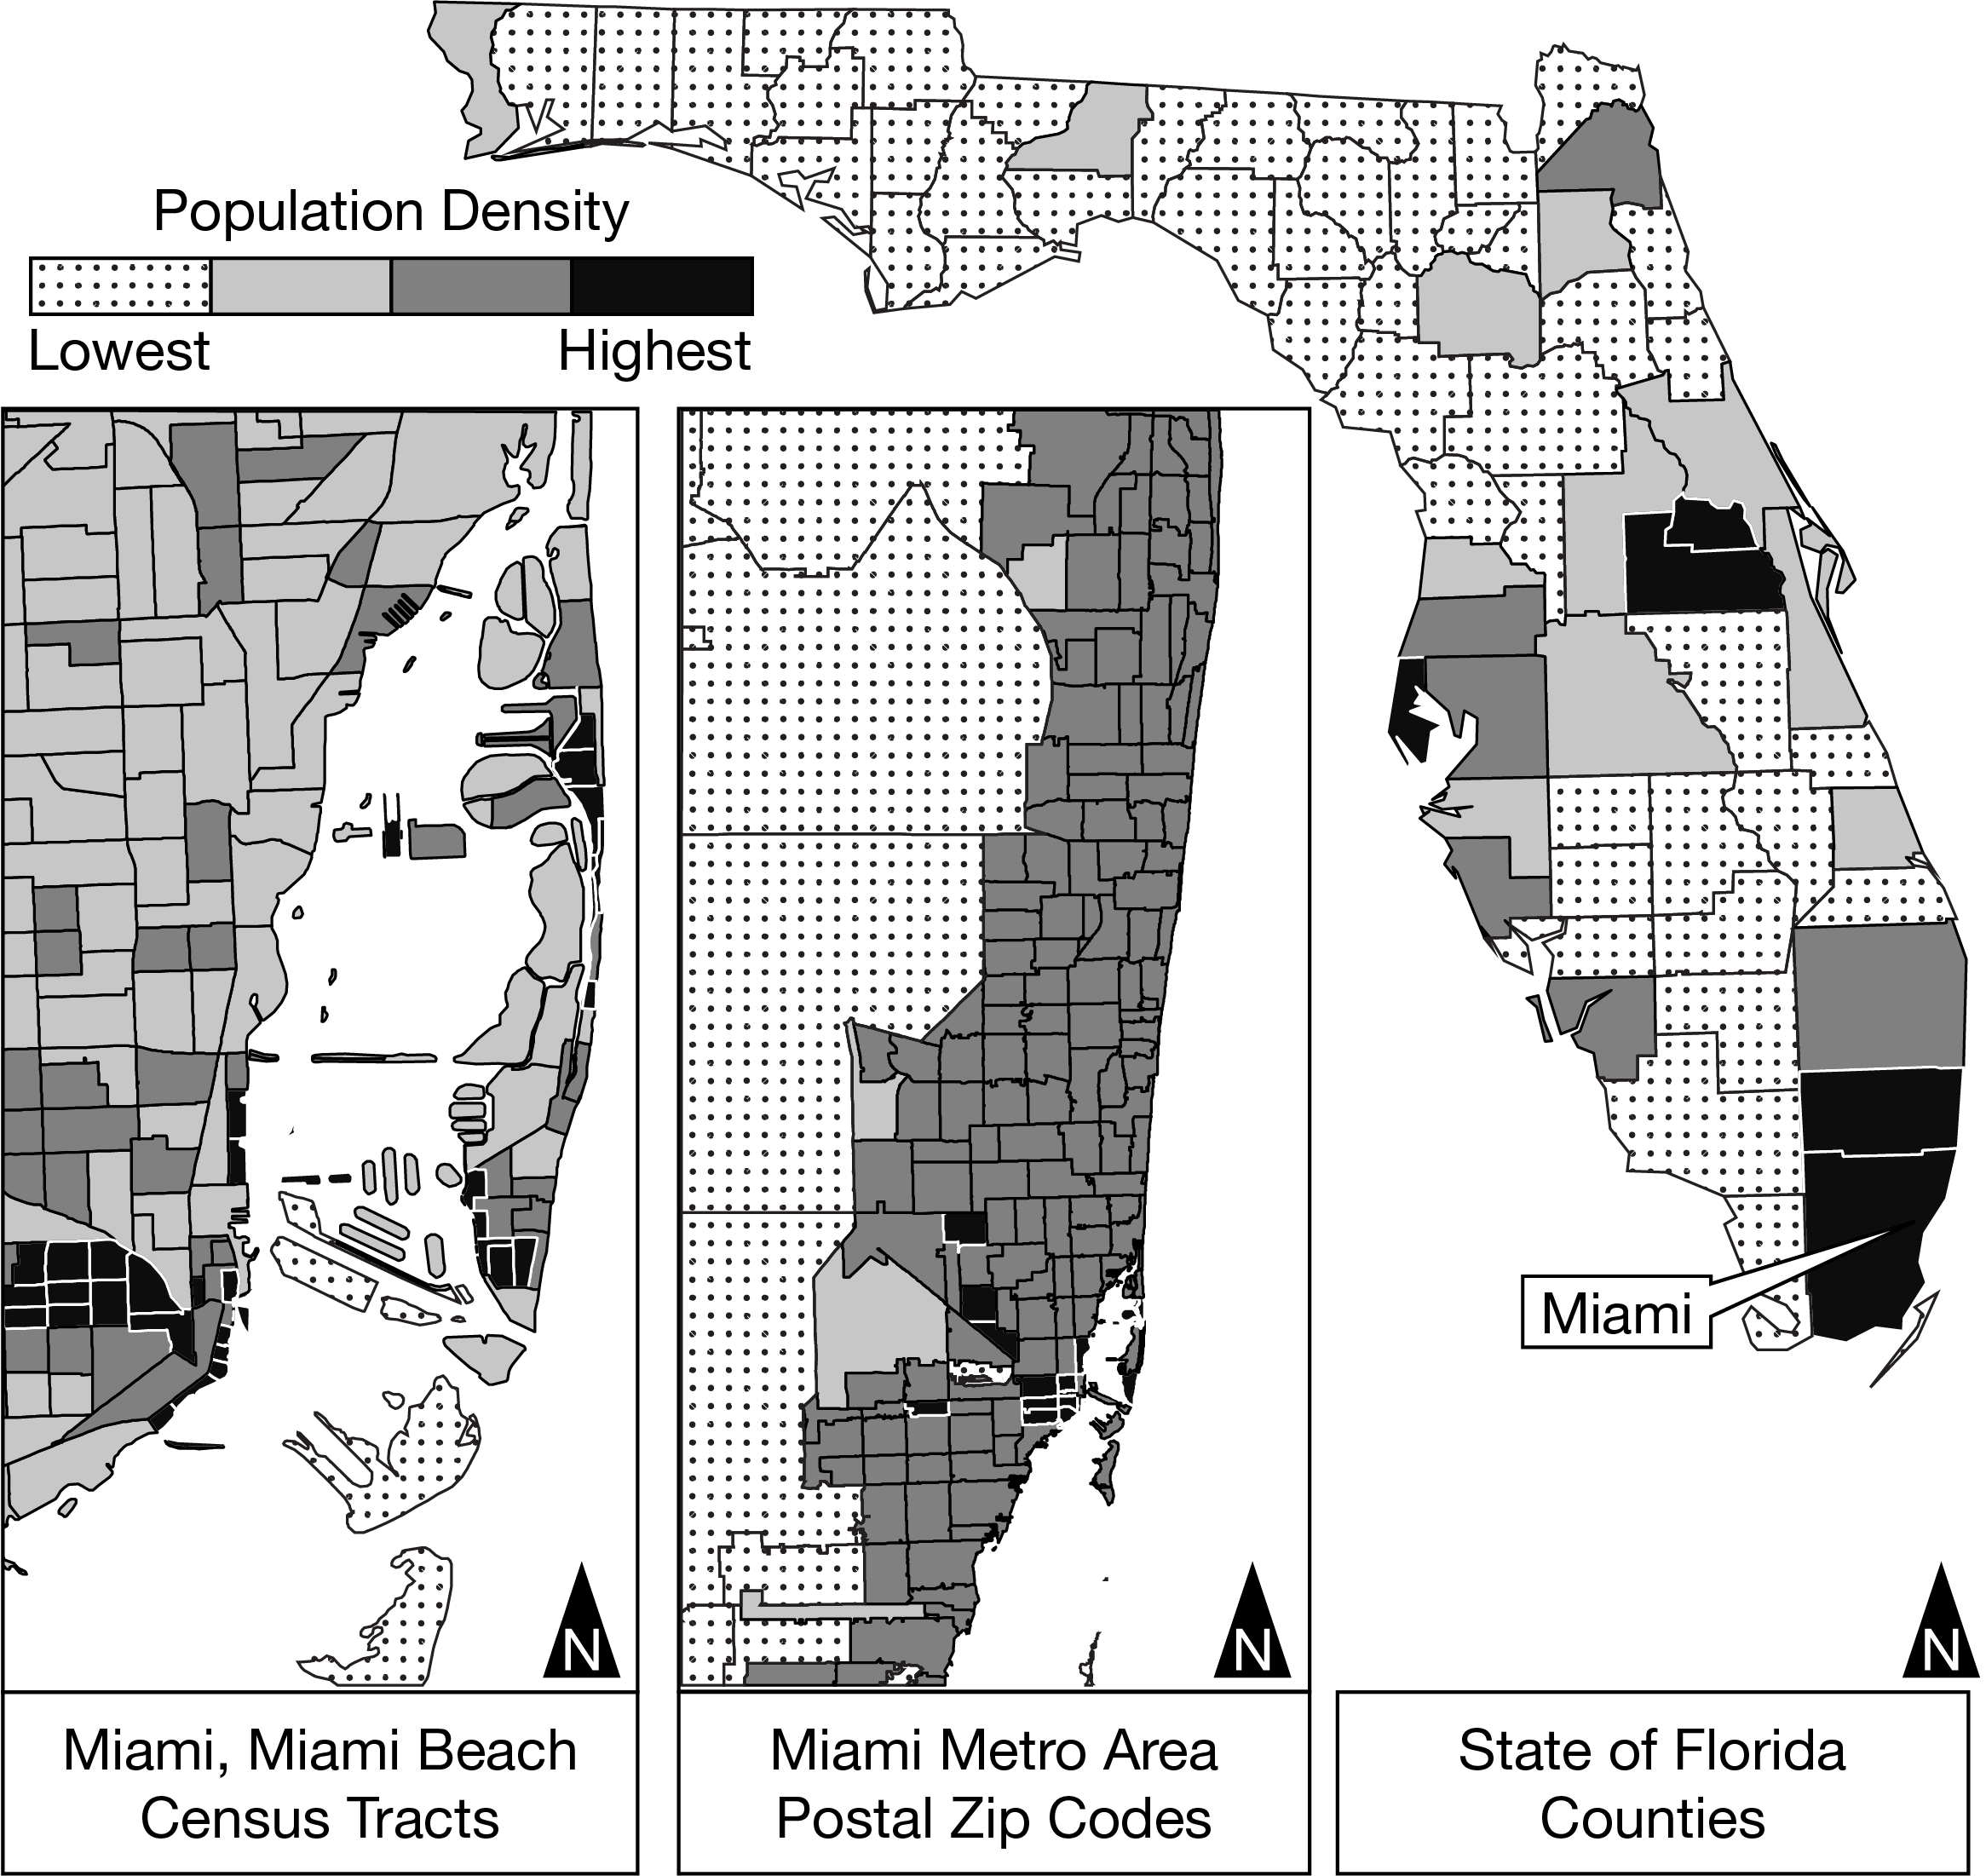
10Which of the following identifies how population density is shown in the maps?
- AA
At different scales, showing administrative units - BB
In different types of physical regions - CC
In different types of culture regions - DD
In different types of vernacular regions - EE
At the same scale, showing different parts of the country
- AA
11Which of the following is the best describes an example of transhumance?
- AA
Ranchers in Canada who allow their cattle to graze over a wide area of flat land - BB
Herders in Kenya who take their goats to a river basin each day for water - CC
Shepherds in France who move their sheep to mountain pastures each summer - DD
Farmers in Peru who raise their llamas on land that used to be tropical rain forest - EE
Traders in Mongolia who maintain a herd of camels and a herd of yaks
- AA
12Which of the following processes best explains a decrease in mortality rates worldwide?
- AA
Increased rates of female literacy - BB
Increased rates of urbanization - CC
Modern family planning methods - DD
Better hygiene and sanitation practices - EE
Greater female workforce participation
- AA
13Region Birth Rate in 2017 (per 1,000 population) Death Rate in 2017 (per 1,000 population)
South Asia 22 6
Eastern Europe 11 13
North America 14 7
East Asia 12 7
North Africa 28 6
Source: Population Reference Bureau
Based on the demographic transition model, which region is best described as exhibiting overall negative rates of growth in stage 4?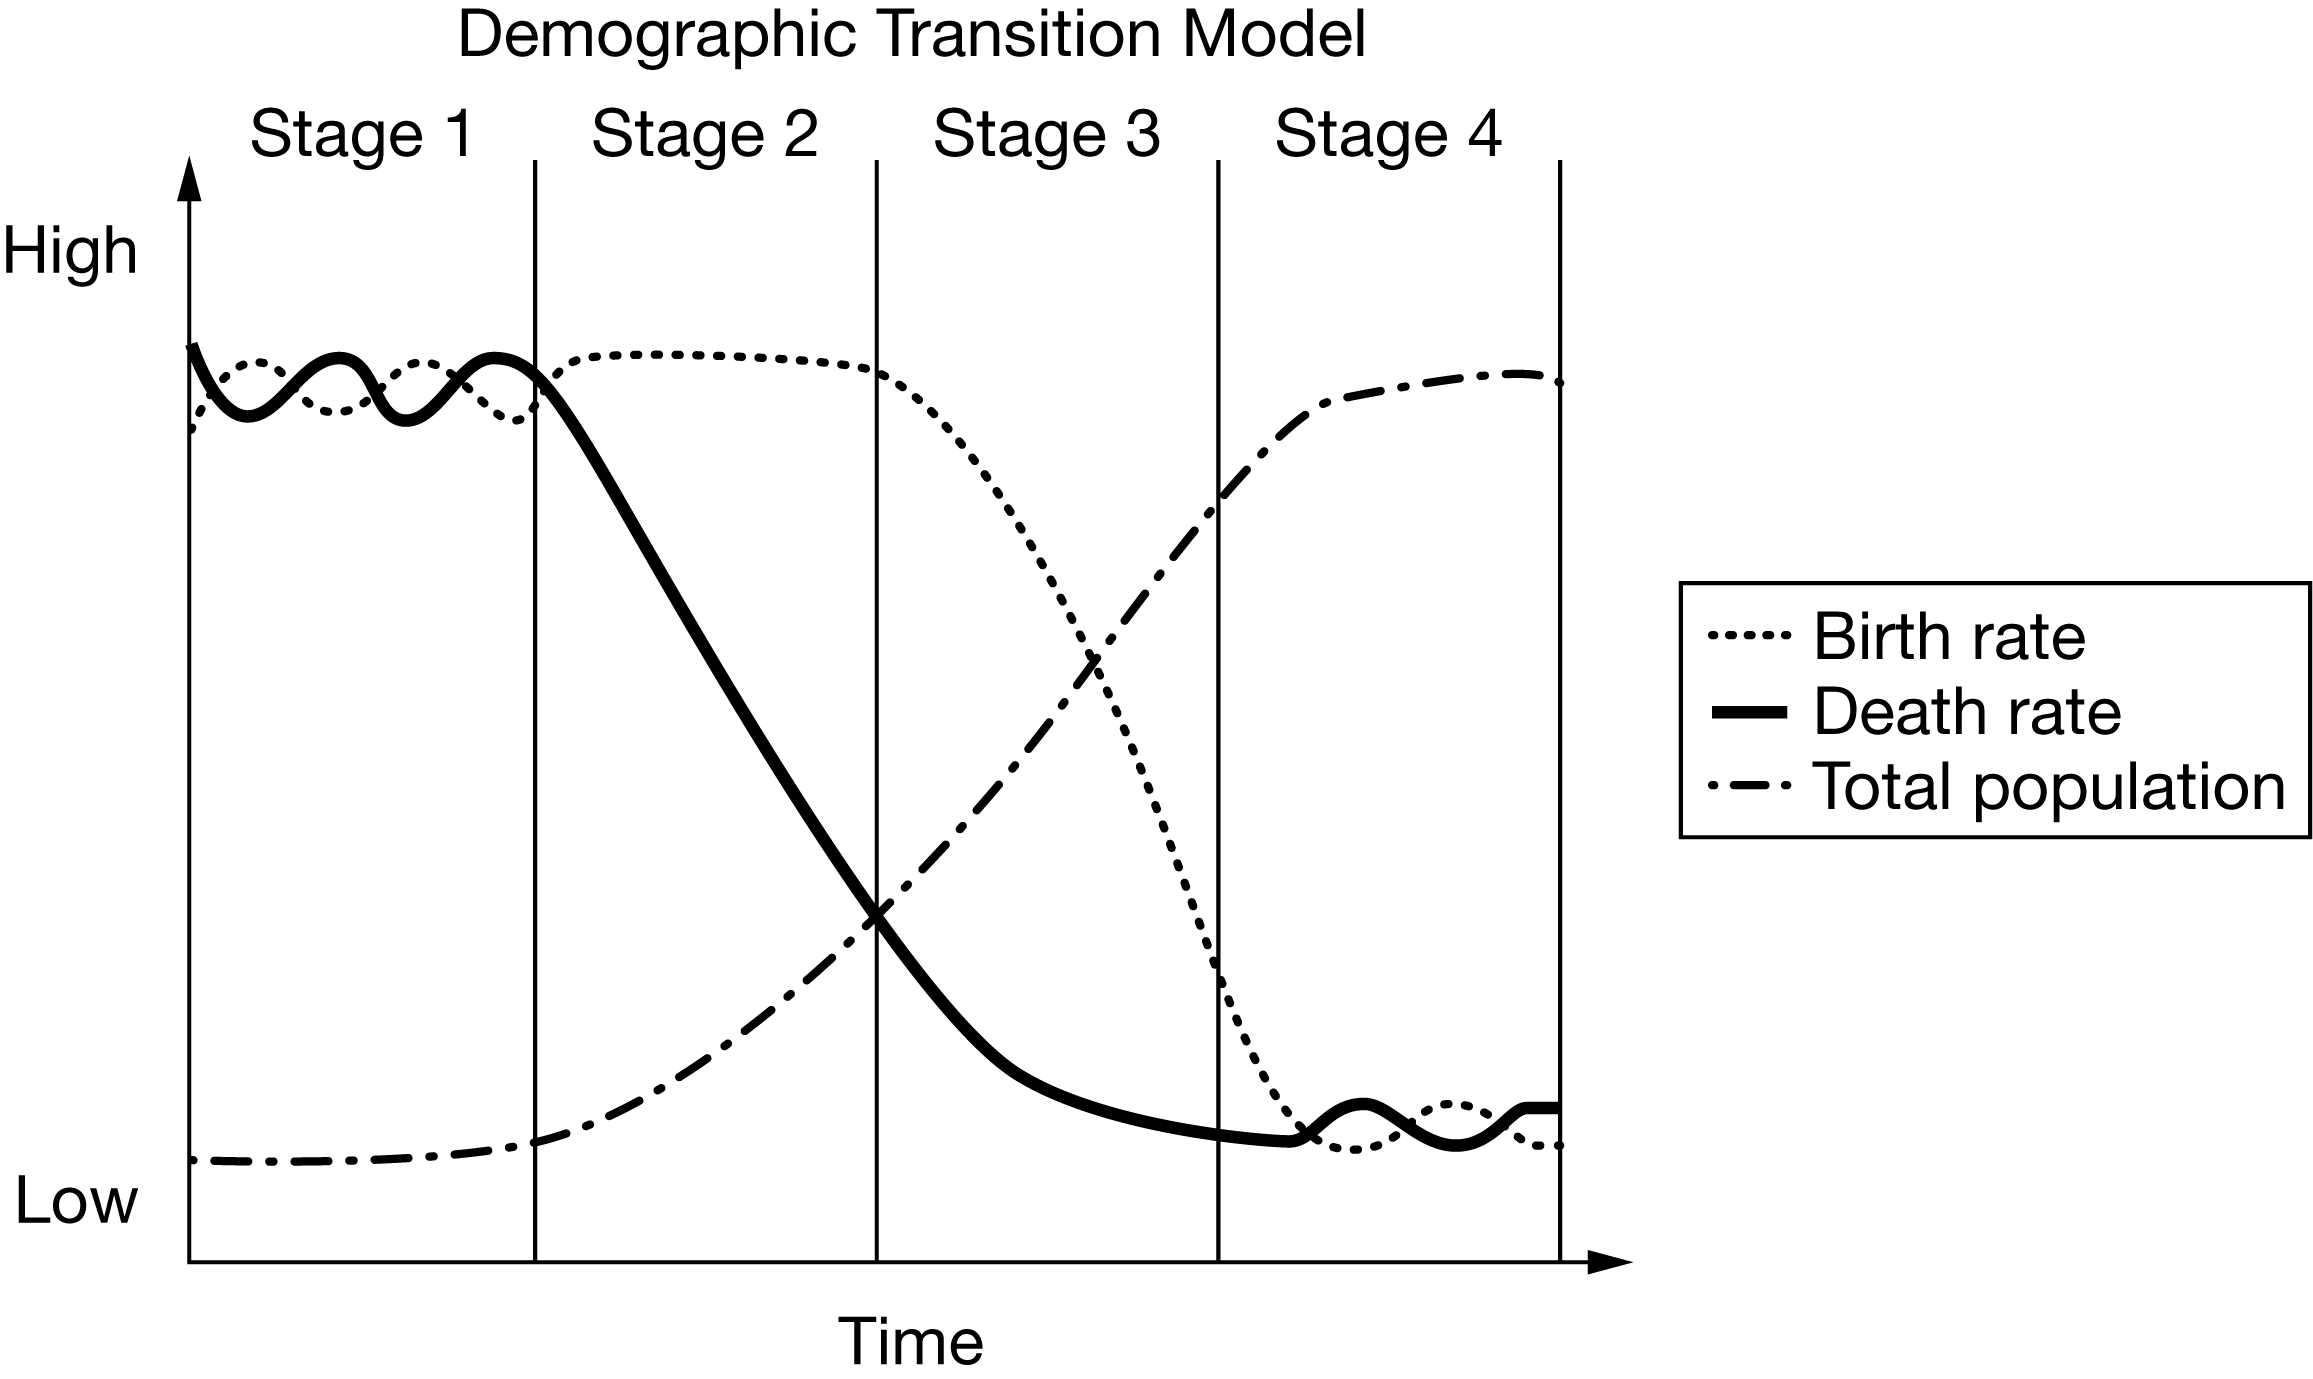
- AA
South Asia - BB
Eastern Europe - CC
North America - DD
East Asia - EE
Northern Africa
- AA
14Region Birth Rate in 2017 (per 1,000 population) Death Rate in 2017 (per 1,000 population)
Latin America 17 6
West Africa 39 11
Western Europe 10 10
Source: Population Reference Bureau
Deaths in Country A often occur due to outbreaks of epidemic disease, while in Country B most people are dying from chronic disorders such as heart disease. Which of the following best describes where these countries fall in the demographic transition model and in which region they are likely located?- AA
Country A : Stage 3, Latin America; Country B : Stage 2, West Africa - BB
Country A : Stage 2, Latin America; Country B : Stage 3, West Africa - CC
Country A : Stage 2, West Africa; Country B : Stage 4, western Europe - DD
Country A : Stage 4, western Europe; Country B : Stage 2, West Africa - EE
Country A : Stage 4, western Europe ; Country B : Stage 2, Latin America
- AA
15Neo-Malthusian theory can be used to explain which of the following situations?
- AA
Brazil’s interior was previously unfit for farming, but recently more land is being cultivated. - BB
Mexico has utilized new technology to shift from being a food importer to being a food exporter. - CC
Malawi previously experienced famine but has improved agricultural yields through subsidies. - DD
India has been able to increase agricultural yields by utilizing bio-engineered seeds. - EE
South Sudan experienced famine during the twenty-first century as a result of war and drought.
- AA
16South Korea, as of 2018, has the lowest total fertility rate in the world at 1.1. Which of the following best explains a population policy South Korea could enact to promote higher birth rates?
- AA
Decreasing the age of retirement so that older Koreans can work in childcare centers - BB
Decreasing the cost of childcare so that families can afford to have more children - CC
Increasing social-security benefits so that retirees can financially support their grandchildren - DD
Decreasing health insurance so that parents pay more for the cost of childbirth - EE
Increasing educational costs for universities so that the government can spend more on preschool
- AA
17Many countries in sub-Saharan Africa have total fertility rates that exceed 5.0. Which of the following population characteristics is associated with this phenomenon?
- AA
High youth dependency ratio - BB
Long life expectancy - CC
Low birth rates - DD
High elder dependency ratio - EE
Zero population growth
- AA
18TOTAL FERTILITY RATES
Country 1960 1970 1980 1990 2000 2010
Canada 3.81 2.26 1.74 1.83 1.49 1.63
United States 3.65 2.48 1.84 2.08 2.06 1.93
Source: World Bank
WOMEN’S EDUCATION ATTAINMENT: PERCENT WITH HIGH SCHOOL DIPLOMA OR HIGHER
Country 1960 1970 1980 1990 2000 2010
Canada 34.0% 58.5% 64.9% 73.9% 85.1% 91.1%
United States 42.5% 52.8% 65.8% 74.8% 80.7% 87.6%
Sources: Statistics Canada, United States Census Bureau
Which of the following describes the relationship between fertility and education in the United States and Canada in recent decades?- AA
The decrease in the percent of women who are more highly educated results in a larger number of children entering school. - BB
The decrease in the percent of women who are more highly educated correlates with the decline in fertility. - CC
The increase in the percent of women who are more highly educated correlates with the increase in fertility. - DD
The increase in the percent of women who are more highly educated correlates with the decline in fertility. - EE
The increase in the percent of women who are more highly educated results in a larger number of children entering school.
- AA
19BANGLADESH, TOTAL FERTILITY RATE AND RATE OF NATURAL INCREASE
Year Total Fertility Rate Rate of Natural Increase
1990 4.49 2.5%
1995 3.71 2.3%
2000 3.17 2.1%
2005 2.69 1.8%
2010 2.33 1.6%
2015 2.13 1.4%
Source: World Bank
Bangladesh has seen its total fertility rate drop to 2.1, but its population is projected to be higher in 2050 than it is today. Which of the following explains why Bangladesh will continue to experience positive rates of natural increase?- AA
Bangladesh will continue to grow because it will receive a high number of immigrants. - BB
Bangladesh was experiencing low birth rates, but it is predicted to have a baby boom. - CC
Bangladesh’s population will continue to grow as a result of a large youthful population. - DD
Bangladesh will promote pronatalist policies to avoid a diminished workforce. - EE
Bangladesh will continue to grow because a fertility rate of 2.1 is still above replacement level.
- AA
20Which of the following explains an impact of open-border policies regarding migration within the European Union?
- AA
Increased free trade within Europe based on elimination of tariffs, due to the need for economic cooperation between member states - BB
Greater cultural unity within Europe as it becomes a melting pot, due to the use of a common currency - CC
Growing political tensions as immigration increases, due to competition between immigrants and local people for available jobs - DD
Greater restrictions on travel within European Union countries, due to the need for internal security - EE
Less environmental pollution as a result of stricter regulations, due to member states agreeing on a common air-quality policy
- AA
21From 2010 through 2017 there was a large increase in the number of migrants from Africa to Europe. Which of the following explains a possible impact on the emigrant countries of origin during and after that time period?
- AA
Increasing emigration resulted in the governments of the countries of origin providing financial support for emigrants. - BB
As more emigrants sent money home, the influx of money created an economic boom in the countries of origin. - CC
Increasing emigration resulted in a decreased need for language training programs in schools to help emigrants find work. - DD
Many emigrants became unemployed, which decreased the total financial contributions to countries of origin. - EE
Remittances increased diffusion of cultural traits such as customs, religion, and food products from the host countries to the countries of origin.
- AA
22Immigration of asylum applicants from Africa to the European Union, Norway, and Switzerland increased from approximately 50,000 in 2010 to approximately 200,000 in 2016. In 2017, there were approximately 175,000 asylum applicants. Which of the following best explains the trend in asylum seekers from African countries to Europe since 2010?
- AA
Improvement in the level of economic development in African countries led to an increase in the number of asylum seekers. - BB
A decrease in the number of armed conflicts in African countries meant a higher number of asylum seekers traveling to Europe. - CC
Political instability and conflict along with high fertility levels over the long term has led to an increase in asylum seekers. - DD
Low fertility rates and more stable political systems led to an overall decrease in asylum seekers as they found more economic opportunities at home. - EE
An influx of asylum seekers from the Middle East led to a decrease in the number of accepted asylum applications from Africa.
- AA
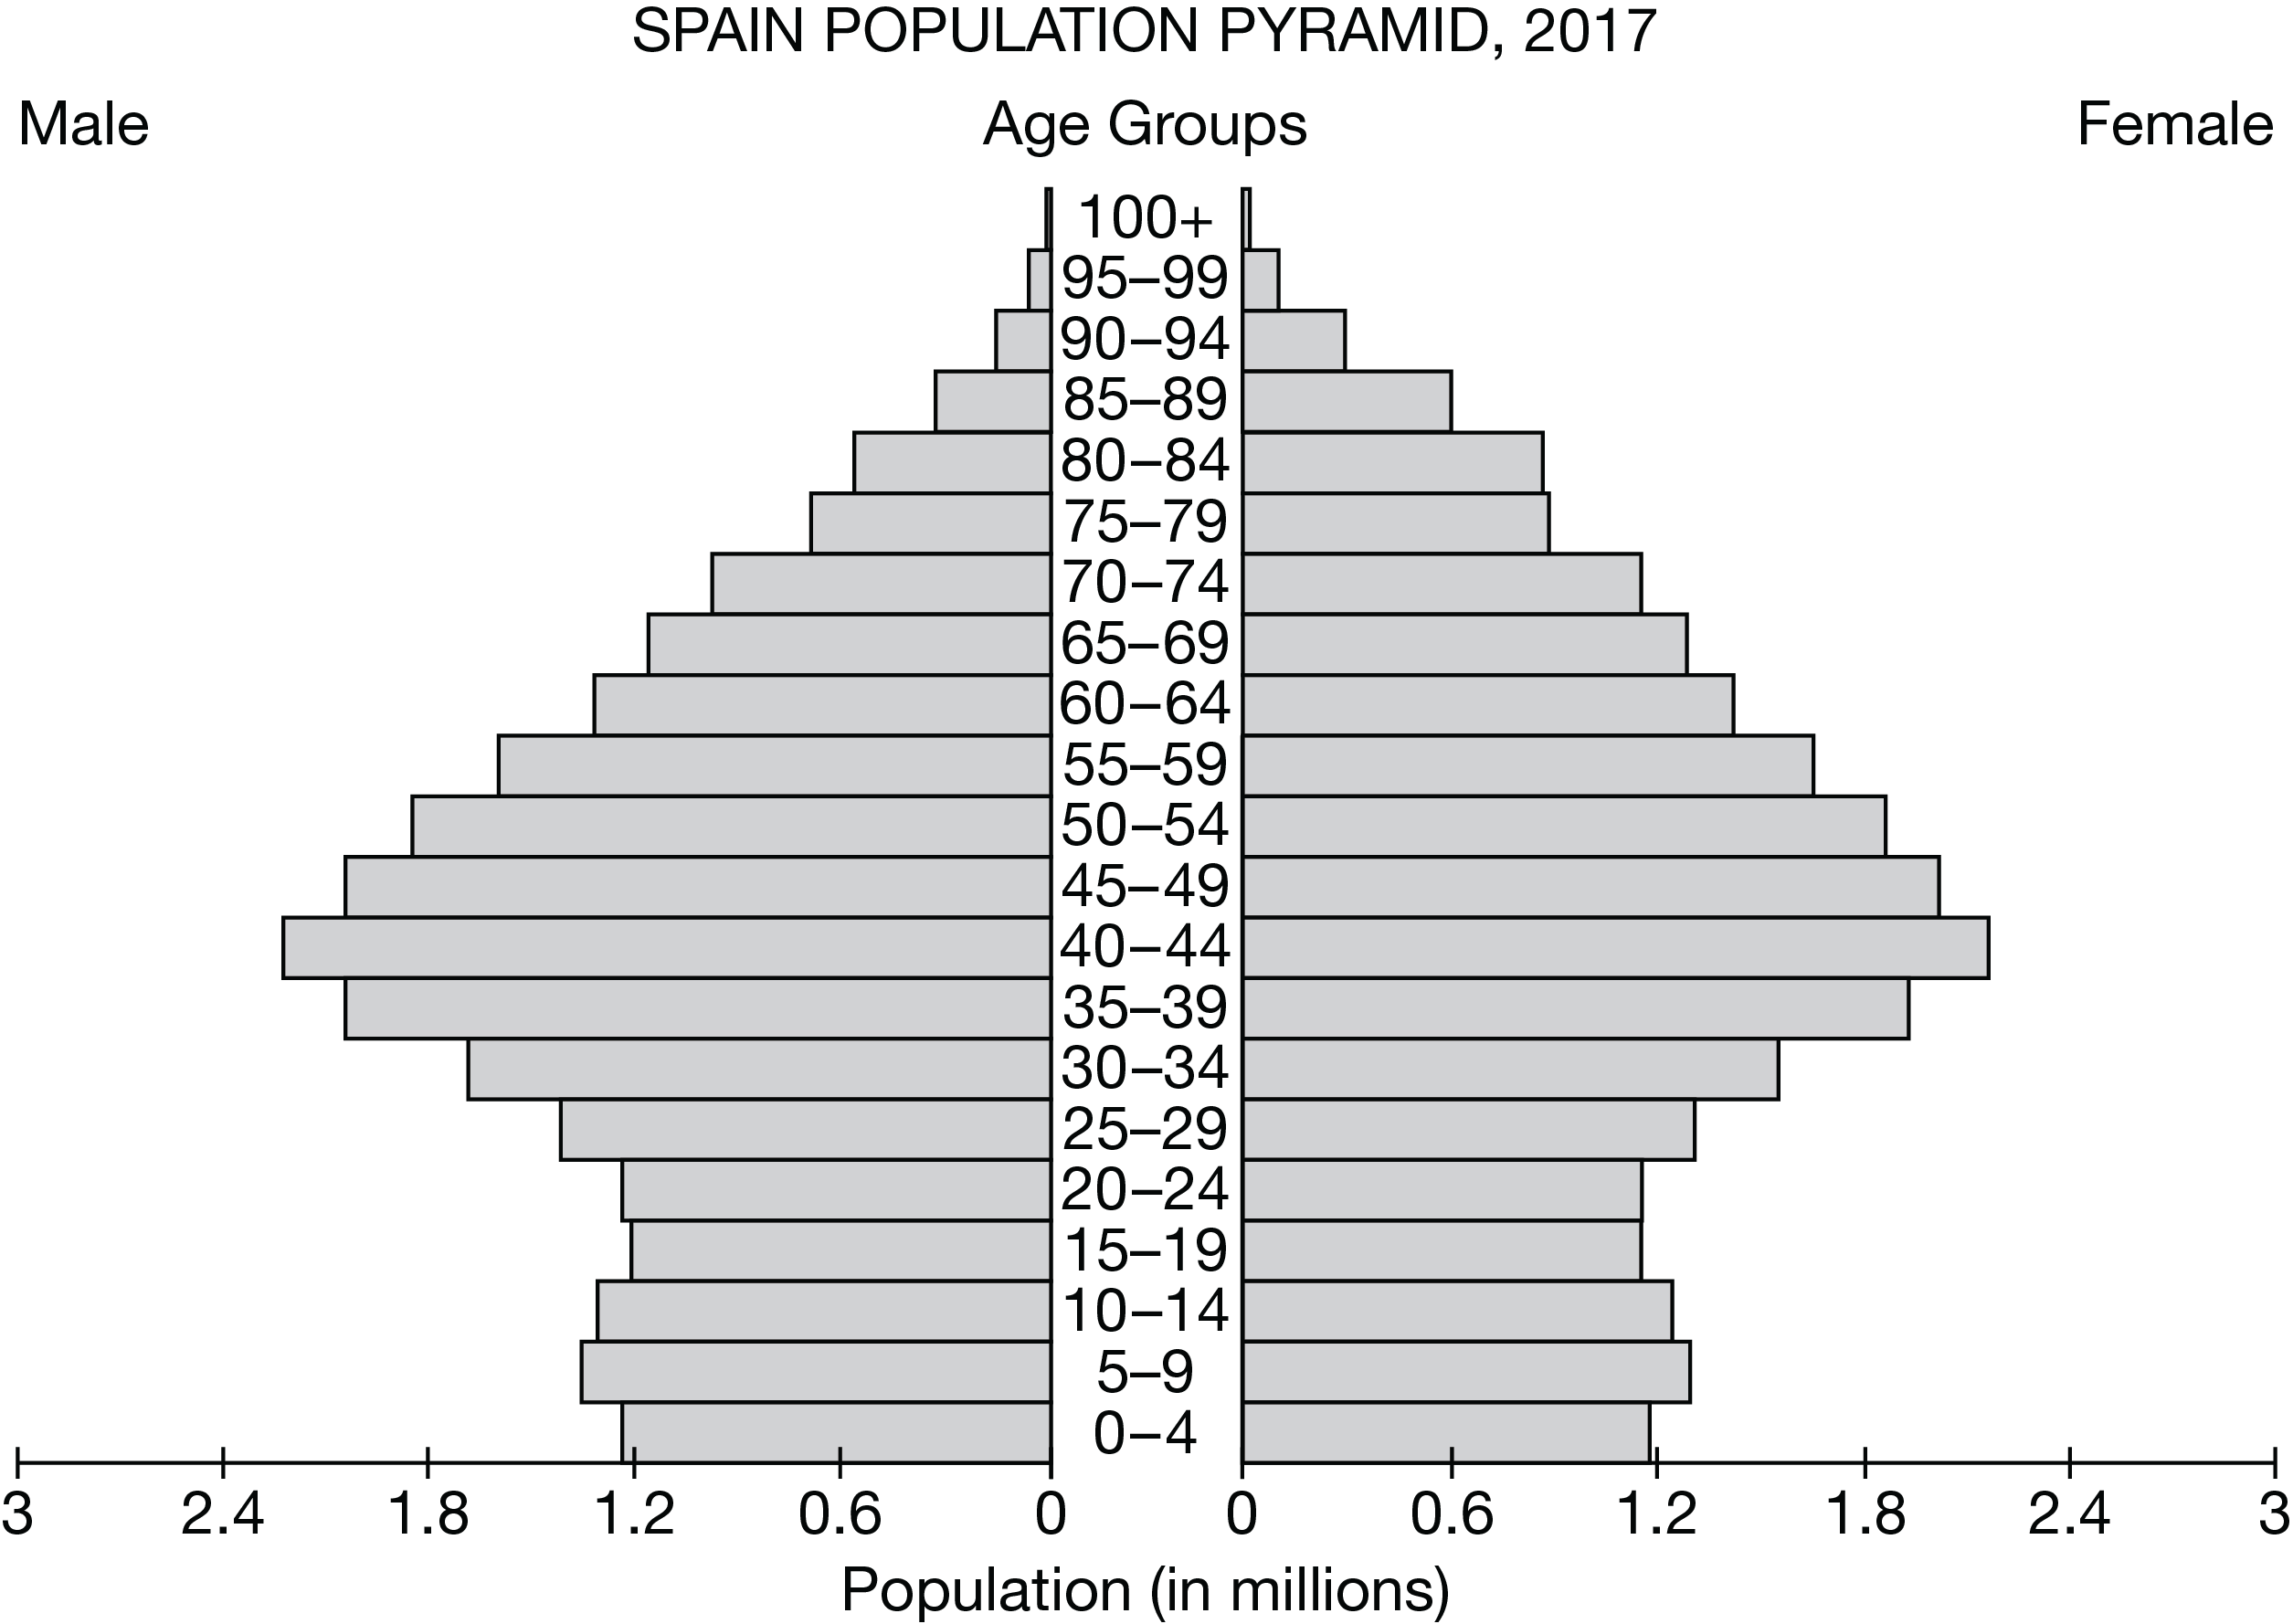
23Which of the following explains how data from the population pyramid for Spain would be useful for government policy makers?
- AA
Data on the annual number of legal immigrants would be used to establish policy on international refugees. - BB
Data on voters’ party memberships would be used to locate target audiences during political campaigns. - CC
Data on the population of adult women would be used to plan for the numbers of children starting school. - DD
Data on the size of the rural population would be used to set up health clinics for the elderly. - EE
Data on the size of the middle-aged population would be used to plan for retirement and social security benefits.
- AA
24In 1980 China implemented an antinatalist one-child policy. Which of the following explains an unintended consequence of the policy?
- AA
There are more women than men because of a cultural preference for female children. - BB
There are more men than women because of a cultural preference for male children. - CC
China’s total fertility rate dropped below the replacement rate due to strict enforcement of the law. - DD
China’s age structure shifted toward a high youth dependency due to limiting births. - EE
China discontinued the policy to accommodate an unexpected increase in infant mortality rates.
- AA
25Malthusian theory would explain which of the following possible consequences of high birth rates in a less developed country?
- AA
Famine and starvation will occur as demand outpaces agricultural production. - BB
Technological advancements will lead to increased agricultural production. - CC
People will implement family-planning methods as resources grow scarce. - DD
Areas with the greatest population density will import scarce resources. - EE
Farmers will bring more land under cultivation to produce more food.
- AA
26Based on the diagram of the demographic transition model, which of the following correctly describes the expected population change over time?
- AA
As birth rates remain high and death rates decrease, the total population remains stable. - BB
As birth and death rates are high, population growth remains high. - CC
As birth rates are higher than death rates, population growth remains high. - DD
As birth and the death rates lower, the total population remains low. - EE
As birth rates drop below death rates, the total population remains stable.
- AA
27Many European countries provide families one or more of the following: tax credits, flexible parental leave, monthly payments, public-transportation fare reduction, free vaccines, and subsidized childcare.
Which of the following would explain why a country such as Belgium would implement the described policies?- AA
Belgium has concerns about gender equality and wants to increase female participation in the workforce. - BB
Belgium has concerns about an aging population and wants to encourage higher birth rates. - CC
Belgium has concerns about a large youth population and wants to encourage lower birth rates. - DD
Belgium has concerns about the ability of immigrants from developing regions to support themselves. - EE
Belgium has concerns about an aging population and wants to encourage lower birth rates.
- AA
28BIRTH RATES AND DEATH RATES IN SELECTED COUNTRIES
Country Birth Rate
per 1,000 population Death Rate
per 1,000 population
Ethiopia 33 7
Germany 9 11
Bangladesh 19 5
Chile 14 6
Vietnam 16 7Source: Population Reference Bureau
Which of the following statements accurately explains the population dynamics of a country on the table shown?- AA
Women in Ethiopia have increased opportunities to achieve higher levels of education than women in Vietnam. - BB
Chile has a higher rate of emigration than other countries in the table. - CC
Males in Chile have a longer life expectancy than males in Germany. - DD
Germany has a negative rate of natural increase. - EE
Bangladeshi citizens have access to high-quality health care.
- AA
29Which of the following scenarios explains a demographic push factor for less developed countries?
- AA
A large youth population, lacking educational opportunities, seek schooling in more developed countries. - BB
Religious persecution and threats of violence create a refugee crisis in neighboring countries. - CC
A working population, seeking higher wages, emigrate to more developed countries. - DD
Drought threatening agricultural output and food supplies create a refugee crisis in neighboring countries. - EE
An oppressive government discriminates against minorities, forcing ethnic groups to live in rural enclaves.
- AA
30Which of the following describes forced migration?
- AA
Residents from New Orleans, United States, being displaced during Hurricane Katrina - BB
Residents from Sendai, Japan, being displaced during an earthquake and related tsunami - CC
Population movement to cities with more job opportunities created by economic recession - DD
British convicts shipped to Australia in the mid-eighteenth to mid-nineteenth centuries - EE
Northern Europeans moving to southern European countries for health reasons
- AA
31Japan has a low birth rate and a high life expectancy. Which of the following explains why Japan will struggle with demographic challenges in 30 years?
- AA
Too many youth dependents for the education system will require increased taxes. - BB
An aging population needing health care will require more public funding. - CC
Too many workers for available jobs will lead to high rates of unemployment. - DD
A rapidly increasing population will strain the country’s infrastructure. - EE
A rapidly increasing population will strain the available food supply.
- AA
32A country develops new technologies for farming, which help stabilize and increase food supply. According to Malthusian theory, which of the following would best explain those results?
- AA
The new technologies would conserve water and energy supplies. - BB
The new technologies would reduce preventive checks on population. - CC
The new technologies would reduce positive checks on population. - DD
The new technologies would create a rapid decrease in population. - EE
The new technologies would increase the need for preventative checks of population.
- AA
33POPULATION DATA BY COUNTRY LEVEL OF DEVELOPMENT, 2018
Birth Rate
per 1,000 Population Death Rate
per 1,000 Population Total Fertility Rate
Core Countries 10 10 1.6
Semiperiphery Countries 21 7 2.6
Periphery Countries 33 8 4.2Source: Population Reference Bureau
Based on the data shown in the table, which of the following accurately describes changes in the roles of women as countries develop economically?- AA
More women work in agriculture - BB
More women leave the workforce - CC
More women work in professional jobs - DD
Fewer women enroll in secondary school - EE
Most women work in the home
- AA
34A high level of mobility for international migration and employment is best explained by which of the following demographic groups?
- AA
Unmarried men in their late twenties with no children and a university education - BB
Unmarried woman in their twenties with no children and a high school education - CC
Married man in their forties with children and a high school education - DD
Unmarried men in their thirties with children and a high school education - EE
Married woman in their thirties with children and a university education
- AA
35Which of the following population patterns is common in more developed countries?
- AA
High birth rates, leading to younger age structures - BB
An uneven ratio of males to females, leading to lower total fertility rates - CC
Higher population densities in rural areas, leading to scarcity of natural resources - DD
A rapidly increasing working-age population, leading to high unemployment rates - EE
Declining levels of fertility and mortality, leading to older age structures
- AA
36A population pyramid that is wide at the top and narrow at the bottom most likely represents which of the following populations?
- AA
A rapidly expanding population - BB
A stable or declining population - CC
A population with an unusually small percentage of older females - DD
A population of retirees - EE
A population with a large percentage of younger male guest workers
- AA
Informationen
- Beschreibung
- Quiz am APHG Unit 2 Progress Check, erstellt von TINSLEY BROWN am 01/02/2021.
- Autor
- TINSLEY BROWN
- Sprache
- English
- Aufrufe
- 1
- Schlagwörter
- Bewertung
- Noch keine Bewertungen Bewerte dieses Quiz