
Quiz
Acceleration Pre-Knowledge Quiz
Dieses Quiz enthält Fragetypen, die sich im gewohnten Player öffnen.
Fragen in diesem Quiz (10)
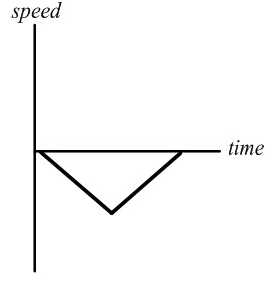
1The Velocity versus Time graph above represents the motion of a toy car.
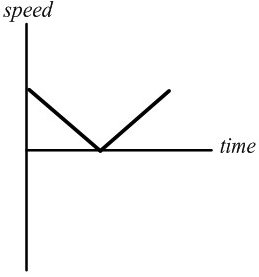
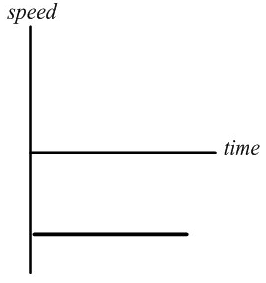
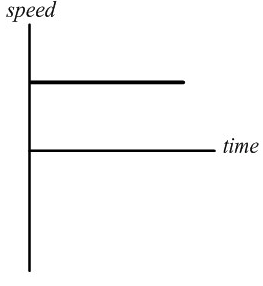
Which of the following represents the Speed versus Time graph of the toy car?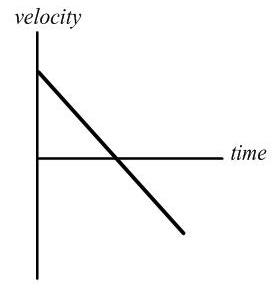
- AA
- BB
- CC
- DD
- AA
2Activity 1 Question 1
The video indicates that there are 96 frames for each second. How many seconds do 48 frames represent?
[blank_start]answer[blank_end] seconds- A0.5
3On your graph, neatly draw a line that you can use to determine the average velocity of the ball between 0.5 s and 2.0 s, then perform the necessary calculations using this line.
In the field below, enter your calculated value of the average velocity of the ball.
[blank_start]answer[blank_end] metres / second.- A0.56
4On your graph, neatly draw the appropriate line that will enable you to determine the instantaneous velocity of the ball when it is at a position of 0.40 m.
Enter the instantaneous velocity below.
[blank_start]answer[blank_end] metres/second- A0.6
5The drawing shows the motion diagram of a car that has been photographed at equal time intervals. The dot represents the position of the front of the car.
The description that could describe the motion of the car is:
- AThe car is moving to the left, first speeding up and then slowing down.
- BThe car is moving to the right, first speeding up and then slowing down.
- CThe car is moving to the right and slowing down.
- DThe car is moving to the right and speeding up.
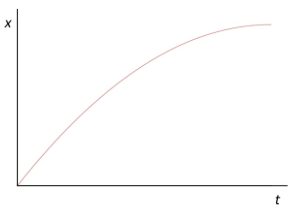
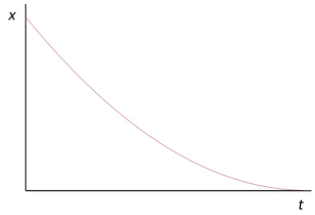
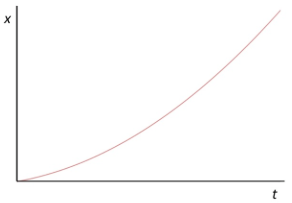
6The drawing shows the motion of a car that has been photographed at equal time intervals. Assume that the car is moving toward the right.
The Position versus Time graph that could match the motion of the car is:- A
- B
- C
- D
- A
7What is the average velocity of the car between 2.5 s and 7.5 s?
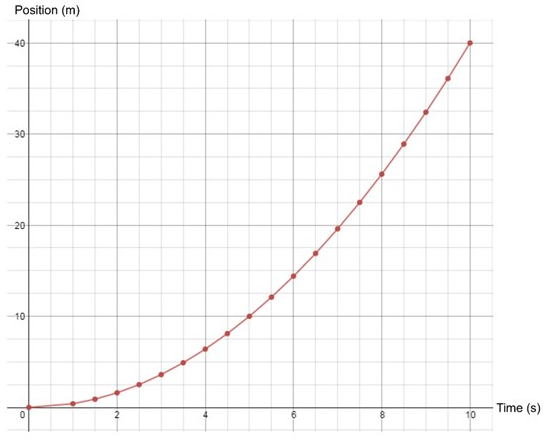
- A1.0 m/s
- B2.0 m/s
- C3.0 m/s
- D4.0 m/s
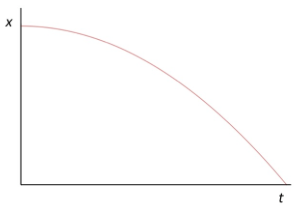
8The Position versus Time graph of a car is shown at the left:
What do you need to do to determine the instantaneous velocity of the car at 5 s?- ADraw a tangent line at 5 s and calculate the slope of the line.
- BDraw a secant line between 0 seconds and 10 seconds and calculate the slope of the line.
- CDraw a secant line between 0 seconds and 10 seconds, calculate the slope and divide it by 2.
- DRead the position value that corresponds to 5 s and divide it by 5.
9The graph below describes the motion of a car.
Which of the following are correct verbal descriptions of the car's motion? Select TWO choices.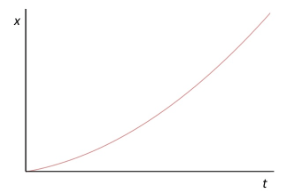
- AThe car is definitely moving to the right.
- BThe car is definitely moving in the positive x-direction.
- CThe car is definitely slowing down.
- DThe car is definitely speeding up.
10It is observed that a car traveling toward the south on a straight highway is slowing down.
Which of the following statements must be true? There are two correct statements.- AThe velocity and speed are both positive
- BThe velocity vector is directed south
- CThe acceleration vector is directed south
- DThe acceleration vector is directed north
Informationen
- Beschreibung
- KS4 prior knowledge quiz on acceleration
- Autor
- Jeffrey Piggott
- Sprache
- English
- Aufrufe
- 192
- Schlagwörter
- Bewertung
- Noch keine Bewertungen Bewerte dieses Quiz