
Quiz
Stats L2
Dieses Quiz enthält Fragetypen, die sich im gewohnten Player öffnen.
Fragen in diesem Quiz (24)
1[blank_start]Null[blank_end] hypothesis
No effect, no difference or relationship
Calculate a [blank_start]test[blank_end] statistic
Test statistic, e.g. t, is a measure of the size of the effect, difference or relationship; taking into account the variability in the samples
Calculate significance probability p = ?
The probability of observing an effect by chance if the null hypothesis is true
Accept or [blank_start]reject[blank_end] the null hypothesis
p < 0.05 reject null hypothesis - accept hypothesis - there is a significant effect
in statistical hypothesis testing you test the [blank_start]null[blank_end] hypothesis
p < 0.05 the probability of thinking you are right when you are actually wrong- ANull
- Btest
- Creject
- Dnull
2scientists more often try and show that the null hypothesis is in fact true > to avoid unintentional bias
- ARichtig
- BFalsch
3test statistics e.g. T
[blank_start]t[blank_end] tests test for the difference between the [blank_start]means[blank_end] of samples
variation between groups / variation [blank_start]within[blank_end] groups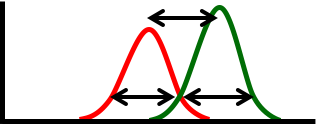
- At
- Bmeans
- Cwithin
4P > 0.05 is not evidence for their being no effect, it only means that we can't say that there is an effect
- ARichtig
- BFalsch
5You can prove things with statistics
we accept a 5% chance of being wrong in biology and medicine- ARichtig
- BFalsch
6P = 0.05 is the level of probability below which scientists commonly claim a [blank_start]significant[blank_end] outcome
- Asignificant
7Data types
nominal categories are [blank_start]mutually[blank_end] exclusive, you cannot survive a bit, ppl are male or female
[blank_start]ordinal[blank_end] = can be ranked, categorical
discrete = based on counts
[blank_start]continuous[blank_end] = on a scale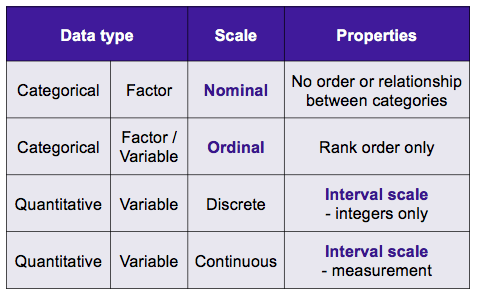
- Amutually
- Bordinal
- Ccontinuous
8Nominal data = statistical test is always [blank_start]chi[blank_end] squared
- [blank_start]nominal[blank_end] data = single counts in [blank_start]categories[blank_end] only > no replicates
- difference in frequency of observation
- association between 2 variables
often used where data is [blank_start]hard[blank_end] to collect or replicate e.g. human disease or death
Is there an association between smoking or not and different types of cancer?
Or big, rare, charismatic things – number of pandas- Achi
- Bnominal
- Ccategories
- Dhard
9study design can be difference or [blank_start]relationship[blank_end]
- [blank_start]independent[blank_end] variable = the thing that is changed a.k.a the [blank_start]explanatory[blank_end] (e) variable or [blank_start]predictor[blank_end] (p) variable --> always on the x axis
- [blank_start]dependent[blank_end] variable = the thing you measure, a.k.a. the [blank_start]response[blank_end] (r) variable- Arelationship
- Bindependent
- Cexplanatory
- Dpredictor
- Edependent
- Fresponse
10explanatory / [blank_start]predictor[blank_end] / independent variable
The thing that has an effect
[blank_start]response[blank_end] / dependent variable
The thing that is affected
The thing that you are interested in measuring and testing
In tests for [blank_start]difference[blank_end] the predictor is a
categorical factor
In tests for relationship the predictor is a [blank_start]scale[blank_end] (sc)
variable- Apredictor
- Bresponse
- Cdifference
- Dscale
11study designs can be [blank_start]difference[blank_end] or relationship and paired or [blank_start]unpaired[blank_end] samples
- Adifference
- Bunpaired
12Parametric assumptions:
- Anormal distribution
- Bequal variances
13If the assumptions of normal distribution and equal variance are not met a [blank_start]non[blank_end]-parametric test is done
but sometimes data can be [blank_start]transformed[blank_end]- Atransformed
- Bnon
14 Report the results of tests for assumptions to
justify your choice of a [blank_start]parametric[blank_end] or non-
parametric statistical test
For most tests, report the [blank_start]test[blank_end] statistic, degrees
of [blank_start]freedom[blank_end] or n (sample size) and the [blank_start]p[blank_end] value
In tests for difference report the appropriate
average (mean or median) with a measure of
variability (standard [blank_start]deviation[blank_end], standard error,
95% confidence interval) for each category
- [blank_start]mean[blank_end] for parametric test
- [blank_start]median[blank_end] for non-parametric test because data is heavily skewed- Aparametric
- Btest
- Cfreedom
- Dp
- Edeviation
- Fmean
- Gmedian
15Standard [blank_start]Deviation[blank_end]
- a measure of variation around the [blank_start]mean[blank_end]
- the average amount by which the observations in a sample differ from the mean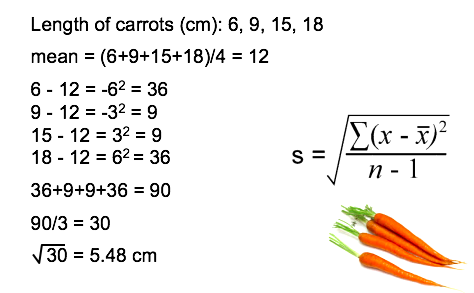
- ADeviation
- Bmean
16standard deviation is the square root of the variance, so the variance is the standard deviation squared
- ARichtig
- BFalsch
17[blank_start]coefficient[blank_end] of variation
- a measure of variation relative to the mean > can be used to compare the variation in samples with different means
coefficient of [blank_start]variation[blank_end] = standard deviation / [blank_start]mean[blank_end]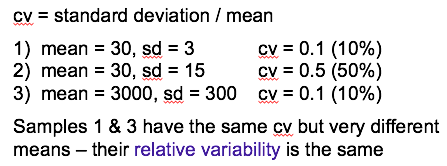
- Acoefficient
- Bvariation
- Cmean
18standard [blank_start]error[blank_end] = the average amount by which a sample mean differs from the [blank_start]population[blank_end] mean
- standard deviation of sample means around the population mean
- a measure of how accurately a sample mean represents the population mean
standard error [blank_start]decreases[blank_end] with decreasing standard deviation
standard error [blank_start]decreases[blank_end] with increasing sample size
standard error = standard error / [blank_start]square[blank_end] root of sample size- Apopulation
- Berror
- Cdecreases
- Ddecreases
- Esquare
19Standard error is used to calculate one more measure of variability = 95% [blank_start]confidence[blank_end] intervals
- in [blank_start]95[blank_end]% of samples the population mean will be within this range- Aconfidence
- B95
20[blank_start]box[blank_end] plots are used to illustrate [blank_start]non[blank_end]-parametric tests and data that is [blank_start]not[blank_end] normally distributed (skewed)
IQR = [blank_start]interquartile[blank_end] range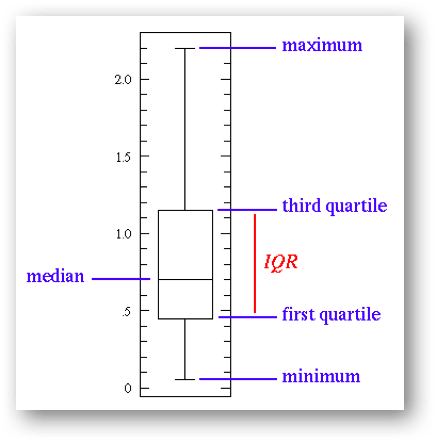
- Ainterquartile
- Bbox
- Cnon
- Dnot
21there are 2 main types of [blank_start]pseudoreplication[blank_end] =
1. accidentally measuring the same sampling unit more than once in a sample
2. taking multiple replicates from the same sampling unit- Apseudoreplication
22what does a boxplot not include?
- Amean
- Boutliers
- Cinterquartile range
- Dmedian
- Emaximum value
23In a journal paper style report, which figure should you use to illustrate the results of an ANOVA test? A [blank_start]bar[blank_end] chart of [blank_start]means[blank_end], with error bars
- Abar
- Bmeans
24[blank_start]Biological[blank_end] replicates are multiple sampling units taken from the same biological e.g. animal or plant. [blank_start]Technical[blank_end] replicates use the same equipment or laboratory methods. In either case you are controlling for variation within a sample or sampling unit. You can use an average of replicates from the same sampling unit for your final data.
- ABiological
- BTechnical
Informationen
- Beschreibung
- Stats Quiz am Stats L2, erstellt von sophie waddington am 19/12/2018.
- Autor
- sophie waddington
- Sprache
- English
- Aufrufe
- 0
- Schlagwörter
- Bewertung
- Noch keine Bewertungen Bewerte dieses Quiz