1065181
| Question | Answer |
| Dependent Variable | what we are measuring - the data we collect - the outcome |
| Independent Variable | the way subjects are grouped (not something we are measuring/collecting data on, per se) e.g., are they in treatment 1 or treatment 2, IV = treatment group // men or women, IV = gender |
| Squaring a Decimal | when squaring decimals, answer should always be in hundredths - so, for example... .6 = .36 .1 = .01 .2 = .04 .3 = .09 |
| Square Root of Decimal | square root = a number you would multiply times itself to get the number in question never take sq-rt of something in tenths - make it into hundredths first so, .5 would be made into .50 (for hundredths = two decimal places), approx .7XX |
| Relationships in Equations A = B/C | --A & B will always have *direct* relationship --A & C will always have *indirect/inverse* relationship direct = as one moves in certain direction, the other moves in SAME direction, i.e., if A increases, B will decrease as well indirect = as one goes in certain direction, the other goes in the OPPOSITE direction, i.e., if A goes up, C goes down common example is formula for Standard Error of the Mean (A) = Standard Deviation of Population (B) / sq-rt of sample size (C) thus - you should know that if SD of population increases, standard error of mean will increase. if sample size increases, standard error of mean will decrease |
| Relationships in Equations A = B*(1-C) | --A and B always have *direct* relationship --A and C always have *indirect* or inverse relationship example - other standard error formulas 1) standard error of measurement (as your instrument becomes more reliable, standard error goes down) 2) standard error of estimate |
| Types of Data | 1. nominal 2. ordinal 3. interval 4. ratio *anything we measure must fall into one of these 4 categories - and it cannot belong to MORE than one category |
| Interval Data | measurement is score or numerical value *aka continuous data *data that has no zero or absolute zero - e.g., temperature (zero has a value), IQ (there is no zero) *thus, we cannot compare scores with interval data like saying a person with an IQ of 140 is 2x as smart as a person with IQ of 70 |
| Ratio Data | measurement is score or numerical value *aka continuous data *data that does have a zero value, e.g., income, weight, depression *thus, we can compare amounts of dependent var's across participants |
| Nominal Data | count or tally of membership in a group or category *groups have no order, e.g., sex, ethnicity *can calculate percentage of membership, e.g., 70% of people said they would vote republican |
| Ordinal Data | count or tally of membership in a group or category *groups have an inherent or valuable order, e.g., class rank, grade level, birth order |
| Descriptive Statistics | simply describe data that is collected - do NOT allow you to make inferences about associations between variables two kinds--> 1) stats that tell us about the group as a whole 2) stats that tell us how one person is doing relative to the group |
| Descriptive Stats of GROUP AS A WHOLE --3 fundamental parts-- | 1) measures of central tendency 2) measures of variability 3) graphing the (whole) group's data |
| measures of central tendency | *group as a whole* one value that tells you central value of whole group of data - what is the central score out of the whole group? 3 possibilities: mean median mode --mean = arithmetic average --median = numerical value that corresponds to 50th percentile rank, i.e., value at which half are above and half are below --mode |
| Mean (measure of central tendency) | arithmetic average |
| Median (measure of central tendency) | numerical value that corresponds to 50th percentile rank, i.e., value at which half are above and half are below |
| Mode (measure of central tendency) | most frequently occurring score - obtained more often than any other score, in group of people, on whatever you are measuring |
| measure of variability | variability/variance -> think "spread" ...how spread out your scores are in a group of data types: standard deviation variance *most widely used measure = standard deviation |
| Standard Deviation (measure of variance) | tells you the avg amount of spread in your group of scores... the larger the SD, the more spread out your scores are note: the mean between two sets of data could be equiv while the SD (the spread) can be different - so, two sets can have SAME measure of *central tendency* but DIFFerent *variability* |
| Variance (measure of variability) | standard deviation squared aka. SD is square-root of variance |
| Range (measure of variability) | (most basic, although little info) difference between the highest and lowest score in your set of data |
| Graphing NOMINAL or ORDINAL Data | use a bar graph x-axis = categories, groups y-axis = frequency (number of ppl in groups) |
| Exception to Bar Graphs | percentile ranks! as groups, percentiles go on x-axis if asked what graph looks like, *always* FLAT or RECTANGULAR ...because there will be equal number of participants in each percentile, thus graph will appear FLAT |
| Graphing INTERVAL or RATIO data | typically graphed with curves x-axis = score (e.g., IQ score) y-axis = frequency (number of people who got that score) w/curve, interested to see if normally distributed or not (normally distributed = bell curve; symmetrical; has midpoint) when data is NOT normally distributed - you have issues of "skew" or "kurtosis" |
| Normal Distribution | same amount of scores ABOVE the mean as scores BELOW the mean |
| Skewed Distribution | does not have same amount of scores above/below the mean |
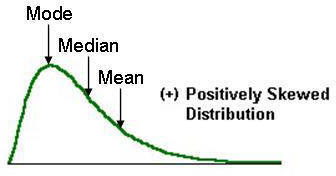
| Positive Skew | higher freq/proportion of LOW scores (hump/curve @ left-negative scores) *HINT: tail of whale points to the positive side for positive skew |
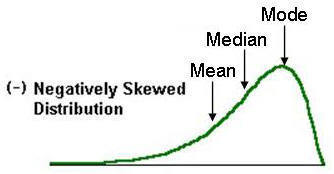
| Negative Skew | higher freq/proportion of HIGH scores (hump/curve @ left-positive scores) *HINT: tail of whale points to the negative side for negative skew |
| Effects of Skew on Central Tendency | it will shift central tendency measures ...mode always occurs at the peak, as it's the most freq'ly occurring value ...then, mean and median occur in alphabetical order, down the "back" of the whale (i.e., towards the skew) |
| Central Tendency Values with POSITIVE skew | |
| Central Tendency Values with NEGATIVE Skew | |
| Highest Value (measure of central tendency) with POSITIVE skew | mean (because it is "last" in order beginning with mode and actually has the greatest value) |
| Highest Value (measure of central tendency) with NEGATIVE skew | mode (because it is "first" in order and is the highest peak among positive/greater values) |
| Raw Score | the amount correct, etc., depending out outcome typically, can use raw score to determine percentage correct both raw score and percentage are CRITERION or DOMAIN referenced scores = tell us how much of criterion (what we tested) did person get corrected ...does very little to give info about how they performed in comparison, e.g., if someone got 80% on test, how do we know if that's good? -- it could be highest score and lowest could've been 20%, but also, 80% could have been the lowest score, with most scoring 100 |
| Percentile Rank | tells you exactly how someone performed relative to group - and it's the most precise measure of this *consider NORM referenced--comparing to normative group/group of ppl who took the test |
| Standard Scores | *NORM referenced based on standard deviations; many diff kinds, importantly--need to know mean and standard dev and then, can compare across diff kinds of standard scores 99% of population will fall within 3 SD's of whatever we're measuring, on bell curve examples/types: 1) z-scores 2) t-scores 2) IQ scores 3) EPPP/GRE scores |
| z-score | tells you exactly how many SD's someone scored above or below the mean on normal distribution curve, you have three dashes (each) to the right and left of mean ...each of these is a standard deviation/z-score Mean = 0 SD = 1 calculating z-score: --need raw score --need mean --need SD (raw score - mean) / SD |
| T-scores | Mean = 50 SD = 10 so, score of 70 is 2 standard dev's above the mean |
| 3 standard values in bell shaped curve | 1) area between -1 and 1 (% of people who will score within 1SD of mean) = 68% 2) area between -2 and +2 = 95% 3) area between -3 and +3 = 99% |
| Percentile Ranks on a Bell Curve | number at which ##% of people score BELOW e.g., if at 50th %ile rank, that means 50 out of 100 ppl scored below e.g., if at 90th %ile rank, that means 90 out of 100 ppl scored below 50th percentile is right in the middle of bell curve, i.e., at 0 when you go up 1SD, %ile rank is higher - better score - @1SD above mean, 84th %ile rank *trick to determine %iles: percentile at -1SD and +1SD will always add to 100, i.e., 16 + 84 = 100 +2SD %ile rank, is 97.5 -2SD is 2.5 +3SD = 99.9%ile -3SD = .1%ile |
| Changing Percentile Ranks | when you have two people in distribution, let's say--> 1) person in the middle of the distribution - 50th rank, e.g., IQ = 100 2) person in the tail of the distribution - 97.2 rank (+2SD's), e.g., IQ = 130 Q: whose rank will change MORE if you 'curve' both their scores? A: the person in the MIDDLE (closer to the mean) ...if they both get 15 extra bonus pts, the guy in 50th percentile has 115 and thus is at +1SD and now, the 84th percentile--he moved up 34 whole ranks. The guy at the tail now has 145 and only moves up 2 ranks |
Want to create your own Flashcards for free with GoConqr? Learn more.