Description
|
|
Created by Lucy Noyes
over 7 years ago
|
|
Page 1
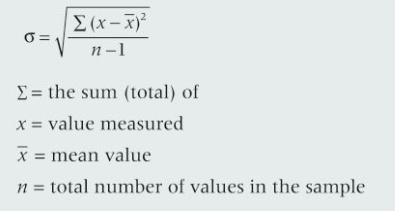
In order to analyse and interpret data it can be represented graphically, allowing us to see patterns. Based on the data they can be put into two categories discontinuous and continuous variation. Discontinuous variation - A characteristic that can only result in certain values. there can be no in-between values eg. an animals sex there are only two values. Continuous variation - A characteristic that can take any value in a range eg. height. Characteristics that show continuous variation are controlled by polygenes and can often be effected by environmental factors. This data can be collected in a frequency table, plotted onto a histogram and a curve is then drawn to show the trend. Normal distribution curves Normal distribution - a distribution of continuous data where the mean, median and mode are the same value.There is symmetry around the mean with more points closer to the middle and fewer around the outside or towards the edges. When continuous data is plotted onto a graph they usually result in a bell shaped curve known as a normal distribution curve and the data is said to be normally distributed. Characteristics of normal distribution are: The mean median and mode are the same It has a characteristic bell shape which is symmetrical around the mean 50% of values are less than the mean and 50% of values are more than the mean Most values lie close to the mean value (numbers at the extremes are low) Standard deviation This is a measure of how spread out the data is. the greater the standard deviation the the greater the spread of data and a larger amount of variation.
Page 2
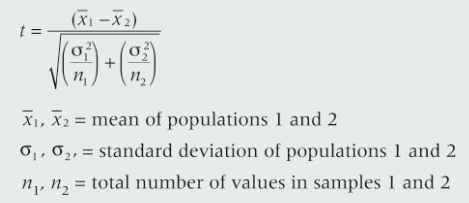
Student t-test This is used to compare the mean values of two sts of data to use this tes : The data collected must be normally distributed Enough data must be collected t create a reliable mean Different sample sizes may be used To understand the value produced means you need to look it up in the student t test significance table. you will need to look at it compared to the degrees of freedom. df = (n1 + n2) -2 n1 = population 1 n2 = population 2
Page 3
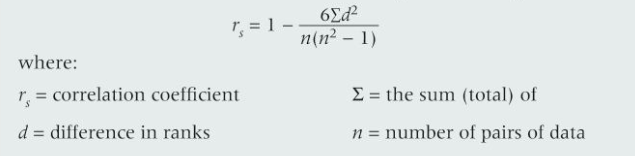
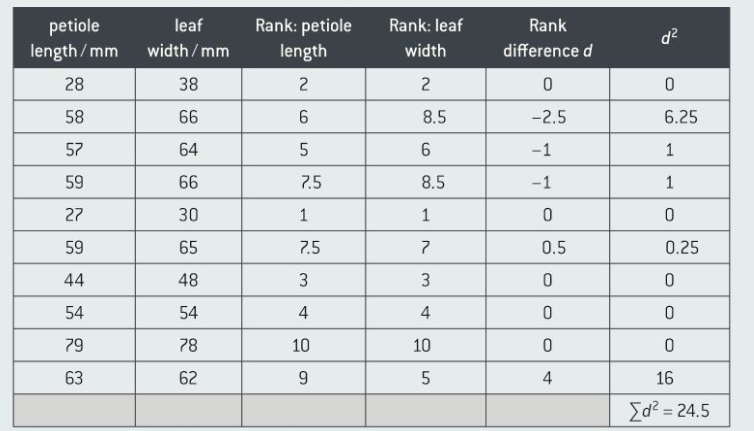
Spearman's rank If two sets of data are related they're correlated. spearman's rank measures the strength and direction of a correlation
Want to create your own Notes for free with GoConqr? Learn more.