GCSE Science (Energy for the home - P1) Note on Sankey diagrams , created by Tom Pass on 11/05/2016.
Pinned to
50
1
0
No tags specified
|
|
Created by Tom Pass
about 9 years ago
|
|
Rate this resource by clicking on the stars below:


 (1)
(1)
Ratings (1)
| 1 | ||
| 0 | ||
| 0 | ||
| 0 | ||
| 0 |
0 comments
There are no comments, be the first and leave one below:
Close
5391966
note
2016-10-25T00:31:38Z
1/1
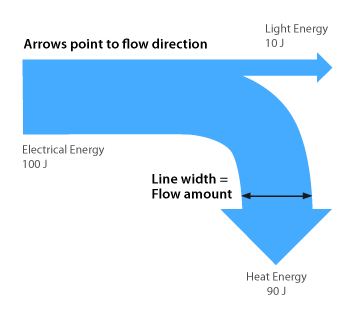
The thickness of the arrow represents the amount of energy.
Sankey diagrams are just energy transformation diagrams – they make it easy to see at a glance how much of the input energy is being usefully employed compared to how much is being wasted.
The thicker the arrow, the more energy it represents – so you see a big thick arrow going in, then several smaller arrows going off to show the different energy transformations taking place.

