
Test
Analysing Box and Whisker graphs
Este test tiene tipos de pregunta que se abren en el reproductor de siempre.
Preguntas del test (10)
1To find the [blank_start]median[blank_end] you must order the data first.
- Amedian
- Bmean
- Cmode
2To make a box and whisker graph, which value do you NOT need?
- Amedian
- Blower quartile (Q1)
- Cupper quartile (Q3)
- Drange
- Eminimum
- Fmaximum
3The range is the highest value [blank_start]minus[blank_end] the lowest value
- Aminus
- Bplus
- Cmultiplied by
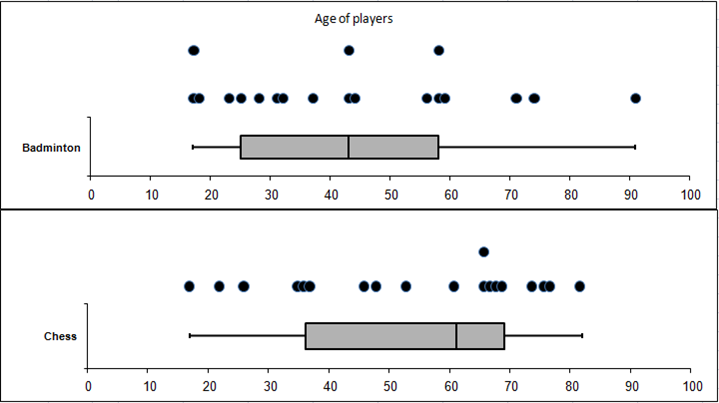
4The median age of the badminton players is 43.
- AVerdadero
- BFalso
5The whiskers at each end of the box are the highest and lowest 10% of data
- AVerdadero
- BFalso
6The length of the box is the IQR (inter quartile range). How do you calculate the IQR?
- APick a number between 1 and 10
- BAdd all the numbers and divide by how many there are
- CSubtract Q1 from Q3
- DSubtract the minimum from the maximum value.
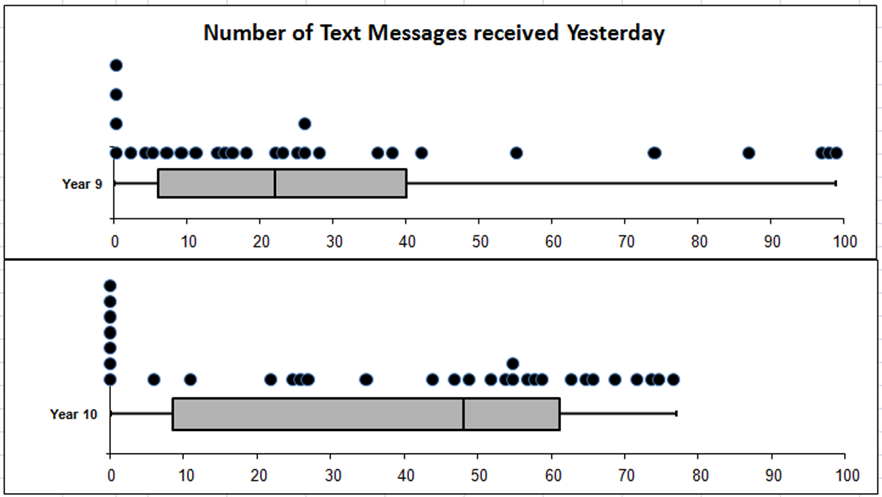
7The IQR of the Year 9s is [blank_start]smaller[blank_end] than the IQR of the Year 10s.
- Asmaller
- Bbigger
- Cequal to
8The mode number of texts sent my Year 10 students is
- A7
- B0
- C4
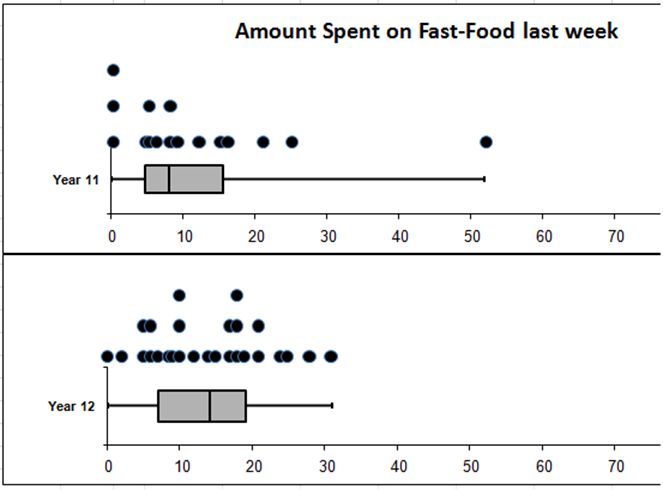
9The shape of the year 12 dot plot is
- Askewed
- Buneven
- Csymmetrical
10The IQR for the Year 11s is similar to the IQR of year 12s. True or false?
- AVerdadero
- BFalso
Información
- Descripción
- Test sobre Analysing Box and Whisker graphs, creado por Sue Sims el 10/09/2019.
- Autor
- Sue Sims
- Idioma
- English
- Visitas
- 18
- Etiquetas
- Valoración
- Aún sin valoraciones Valora este test