
Test
Visualization Study
Este test tiene tiempo límite, así que se abre en el reproductor de siempre.
Preguntas del test (7)
1Which Category has the highest number of orders?
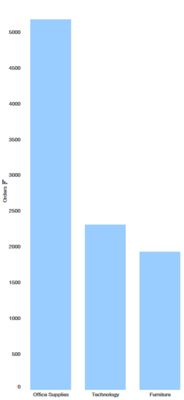
- ATechnology
- BOffice Supplies
- CFurniture
2Which product category has the highest sales?
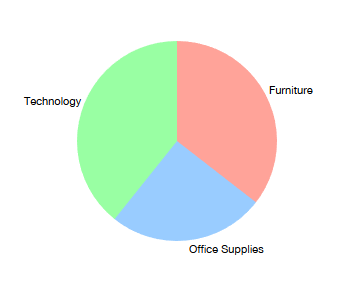
- ATechnology
- BFurniture
- COffice Supplies
- DFurniture and Technology
3Which product category has the highest sales?
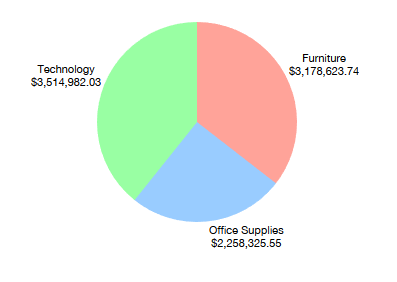
- ATechnology
- BFurniture
- COffice Supplies
- DTechnology and Furniture
4What is true about this graph?
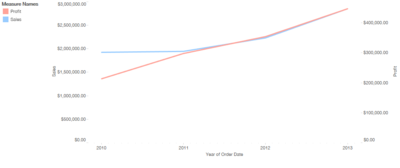
- ASales and profit are almost the same
- BSales are always higher than profit
- CSales growth is higher than profit
- DProfit growth rate is higher than sales
- EProfit was higher than sales in 2012
5Which graph is more visually appealing to show the sales (color) and profit (size) by month?
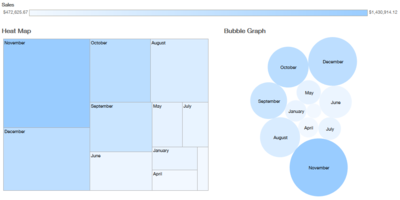
- ABubble Graph
- BHeat Map
6This is an Affinity Analysis, or a Market Basket Analysis to show which Sub-Category Products are most commonly bought together. What statement about this graph are true?
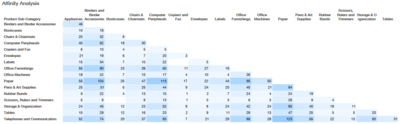
- APaper and Telephones and Communication are most commonly bought together.
- BScissors, Rulers and Trimmers, and Bookcases have never been bought together.
- CCopiers and Fax and Paper have been bought together over 20 times.
- DPens and Art Supplies and Paper are bought together more frequently than Paper and Storage and Organization.
- ECopiers and Fax are the least likely to be bought with anything else.
7What is the meaning of this graph?
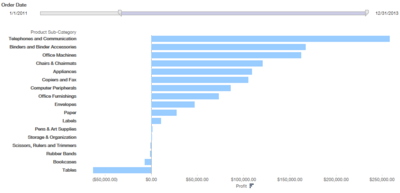
- AProfit By Subcategory for all Order Dates
- BProfit By Subcategory for the last 3 Years
- CProfit By Subcategory for the last 3 Months
- DProfit By Subcategory for the last 3 Weeks
Información
- Descripción
- Test sobre Visualization Study, creado por cmcadoo el 08/07/2016.
- Autor
- cmcadoo
- Idioma
- English
- Visitas
- 0
- Historial
- Creado el 8 jul 2016 · actualizado el 9 jul 2016
- Etiquetas
- Valoración
- Aún sin valoraciones Valora este test